The WHO last week named India’s capital the worst of 1,600 cities for PM2.5 particles. What are the other measures of pollution, and do the experts agree?
Last year, a study by the World Health Organisation found that Delhi had the dirtiest atmosphere of 1,600 cities around the world for PM2.5 particles.
PM stands for particulate matter – solid particles or liquid droplets in the air. When smaller than 2.5 micrometers (that’s 100 times thinner than a human hair), they are known as PM2.5. These are created by such things as vehicle emissions, forest fires and smelting and processing metals.
The WHO recorded an annual average concentration of PM2.5 of 153 micrograms per cubic metre in the Indian capital.
The particles are able to penetrate deep into the lungs, and have been linked with an increase in chronic bronchitis, lung cancer and heart disease. The WHO considers the measurement of PM2.5 to be the best indicator of the level of health risks from air pollution.

According to the WHO data, the equivalent measure for London was 16 micrograms per cubic metre. However, joggers in London were last week told to avoid certain streets in the City due to high levels of air pollution.
But how bad is London? It depends where you compare it with. As the London Air Quality Network (LAQN) points out, due to its dense road network, high buildings, the size of the city and the volume of traffic, the capital fares badly compared with other cities in the UK.
Globally, however, London doesn’t do too badly. The LAQN concludes that after ranking World Bank data on air pollution in 3,226 cities with a population greater than 100,000, from high to low, London would be placed 2,516th.
The World Bank data also shows that air pollution is a bigger problem in developing countries.
There isn’t universal agreement on the pollution measurements. In fact, a member of India’s state-run System of Air Quality Weather Forecasting and Research disputed the WHO figure for Beijing (56) at the time of the report’s publication.
The WHO states that the most health-damaging particles are those with a diameter of 10 microns or less. This is due to the ability of the smaller particles to travel deeper into the lungs and pass into the blood stream.
Sources of PM 10 particles, or coarse particles, can be dirt and dust stirred up on roads by vehicles, or crushing and grinding operations. Mould, dust and pollen are examples of the particles which are between 2.5 an 10 micrometers in size, or about 25 to 100 times thinner than a human hair.
Looking at the data for the annual average mean concentration of PM10 per cubic metre, Peshawar in Pakistan records the highest level. By this measure, Delhi is seventh highest on the list, behind other cities in India such as Gwalior and Raipur.
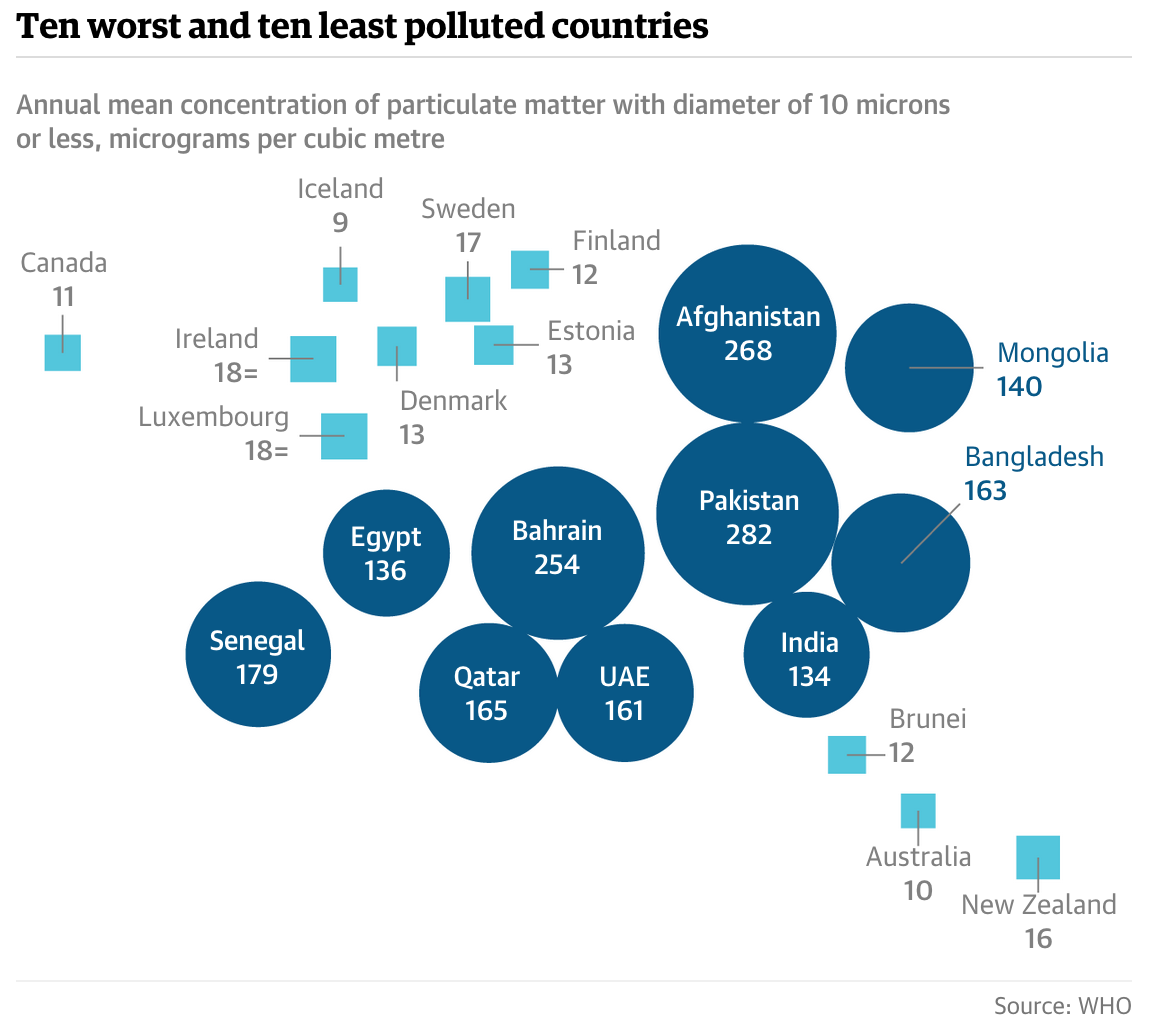
Pakistan records the highest level over all of the 91 countries in the WHO air pollution database.
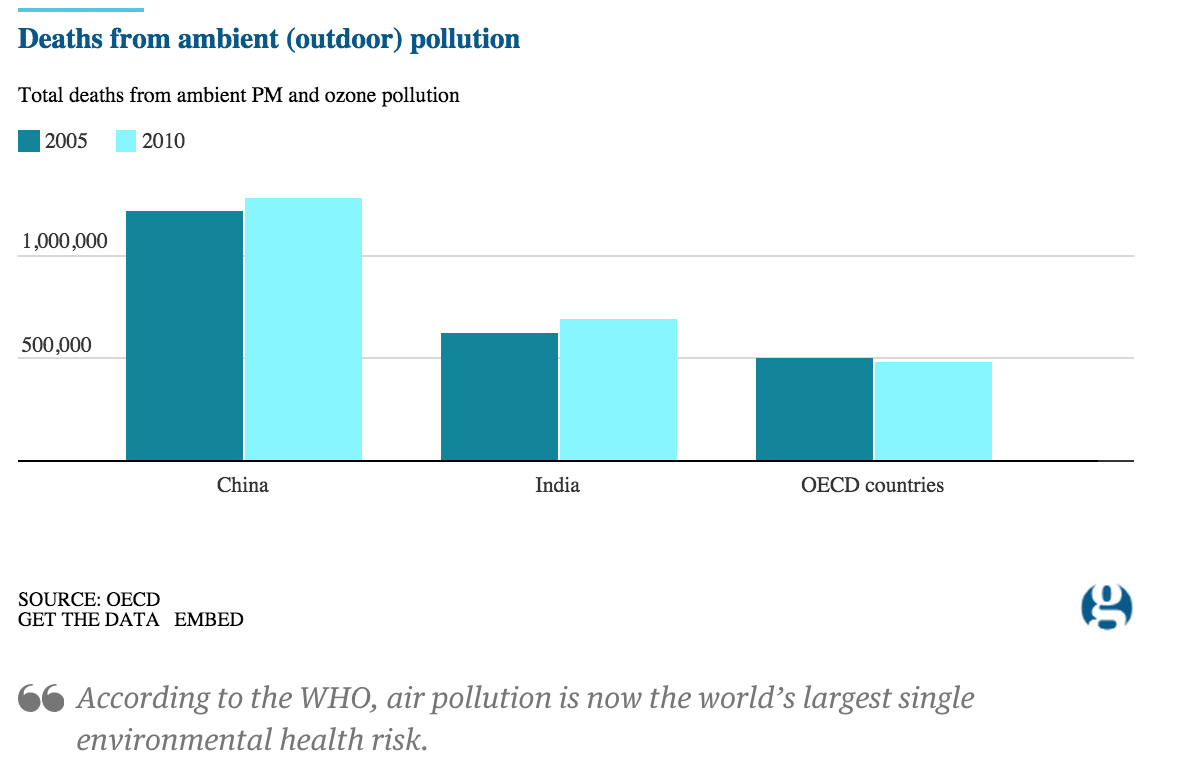
Recent estimates by the WHO placed the number of global deaths as a result of air pollution exposure (inside and outside the home) at 7 million in 2012.
via Air pollution: Delhi is dirty, but how do other cities fare? | News | The Guardian.


 Respro® Masks are reusable