YCDC to measure air pollution at 15 sites

In an attempt to combat worsening air quality, Yangon City Development Committee is installing 15 air quality control machines throughout the city, assistant chief engineer of the pollution and cleansing department U Aung Myint Maw said.

The machines, which will measure levels of dust, carbon dioxide and a dozen other known pollutants, will be positioned in locations assessed to be the most polluted in the city, he said.

“Three permanent machines will be located at Maha Bandoola Garden, near the Hledan overpass and in Mingalardon township. Other locations will use mobile machines,” he said, adding that they had been bought under the committee’s annual budget.

“On the basis of the results, we will draw up a plan for reducing air pollution.”

A 2012 study conducted by the Ministry of Health and the World Health Organisation found many places in Yangon where the air contained more than 100 parts per million (ppm) of dust, especially in the cold and dry seasons, exceeding WHO standards, said U Aung Myint Maw.

Coarse particulate matter – particles with an aerodynamic diameter smaller than 10 micrometres (PM10) – was measured at 80 micrograms per cubic meter, above the WHO’s guideline level of 50 micrograms averaged over a 24-hour period.

But sulfur dioxide and nitrogen dioxide concentrations were much lower than the WHO levels of 100 and 150 micrograms per cubic meter respectively, according to the Ministry of Health.

The 2012 readings were undertaken in January at Hlaing Tharyar Industrial Zone, the department’s office in Ahlone township and a residential area in Bahan township. While the department began measuring air pollution at three locations in 2009, it could not give earlier data for comparison.

But rates are likely to have risen since 2012 due to increases in population, car use and industrial output.

Yangon’s population of about 5.2 million represents more than 10 percent of the country’s total population of 51.2 million people. It is home to one third of all urban-dwellers and about 80pc of its cars. The city is ringed with 24 industrial zones, and population density is growing.

According to a World Bank survey, between 2000 and 2010, Yangon’s area grew from 370 to 390 square kilometres. Its population grew at a more robust 2.6pc a year, the World Bank said.

More details of the air quality improvement plan will be announced once the findings of the machines have been analysed.

via YCDC to measure air pollution at 15 sites.

Posted in Air Quality, Asia | Tagged , , , , | Leave a comment

Boris Johnson advised his London air pollution plans are too little, too late

Mayor’s proposed ultra low emission zone to reduce vehicle pollution should happen sooner than 2020 and cover a wider area, says London Assembly

Boris Johnson’s plan for an “ultra low emission zone” (ULEZ) to reduce London’s air pollution from dirty vehicles should not be delayed for five years and must be widened to cover a much larger area of the capital, the London assembly has told the mayor.

The zone, which Transport for London (TfL) hopes will enable the city to avoid heavy fines from Europe and cut the number of premature deaths from air pollution each year, will not ban traffic but will charge the owners of polluting vehicles up to £100 a day if they drive into most of central London.

With air pollution in London now estimated to be causing the early deaths of over four thousand people a year, the environment committee of the London assembly in its official response to a consultation on the zone argued that waiting until 2020 to introduce the ULEZ would be inexcusable.

Liberal Democrat and Green party assembly members said it should be brought in by 2018 or earlier. But Conservative party assembly members dissociated themselves from the response.

“We are particularly concerned about the report’s recommendations to bring forward the ULEZ to 2018, to increase the daily charge for vehicles and to further tighten the standards. We do not feel that there would be sufficient benefit in going beyond the current proposals, to justify the additional restrictions and costs to vehicle owners, or the impact on London’s economy that these measures are likely to bring,” said the Conservatives.

In a move guaranteed to personally embarrass the mayor, the environment committee also urged TfL not to exempt London’s flagship new routemaster buses from the zone, which Johnson pledged to introduce when he was first elected in 2008 and which first came into service in 2012.

These diesel hybrid buses are expected to be much more polluting than all other London buses by 2020, and should be retrofitted to meet new standards or be banned from the city centre, said the assembly members.

“Levels of NO2 [nitrogen dioxide] are seriously in breach of UK and EU law and are responsible for thousands of early deaths each year in London, as well as other serious health problems. Organisations including London boroughs, the London Health Commission, and the Faculty of Public Health of the Royal Colleges of Physicians have all called for the ULEZ to be strengthened with earlier implementation, wider coverage, stricter standards and stronger incentives,” said the committee.

“Financial costs to a fraction of drivers must be weighed against the health benefits to those same drivers, plus a much larger population of others, who are exposed to air pollution in central London and beyond,” said the assembly members.

via Boris Johnson advised his London air pollution plans are too little, too late | Environment | The Guardian.

Posted in Air Quality, Europe, London, UK | Tagged , , , , , , | Leave a comment

Respro® Masks FAQ: What particle size does the Techno™ mask filter out?

Techno maskWHAT PARTICLE SIZE DOES THE TECHNO™ MASK FILTER OUT?

The Techno™ filter has sub-micron filtration capability. What this means is that it is able to trap particles less than one micron in size which is more than capable of the removal of 2.5 micron particulate material (PM).
Typically particulate pollution in the cities appears to be in the 2.5 micron size range and above. Particles smaller than this are known as respirable dusts, which can lodge deep within the lungs and air sacs. This is the more dangerous type of particle pollution as chemicals from vehicle exhaust gases combustion known to be toxic, are carried by means of the respirable particles. Hence the need for a Hepa-type submicron particle filter.

The DACC Activated charcoal layer within the Techno™ filter has excellent adsorption properties when it comes to SO2 and NO2 uptakes. With this capability and its capability of filtering VOC’s it is the best filter available in our range for dealing with the broad spectrum of pollutants commonly found in major cities across the globe.

For more FAQ,  go to Respro® Mask FAQ

Posted in Air Quality | Tagged | Leave a comment

Which city has the world’s worst traffic jams?

STOP START INDEX

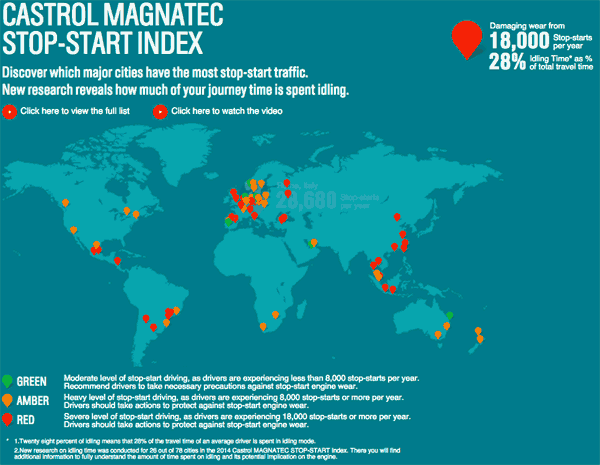
Indonesia’s capital Jakarta has the world’s worst traffic jams according to a new survey by Castrol, its 2014 Magnatec Stop-Start Index. Have sympathy for the city’s drivers, who were recorded as suffering 33,240 stop-starts per year, meaning they spent 27.22% of their total travel time going nowehere.

The index uses data shared anonymously by millions of TomTom navigation users around the world and cover s 78 countries. The next bad city was Istanbul, with drivers spending nearly 29% of their travel time stationary.

Surprisingly omitted perhaps is the notorious Manila, in the Philippines, but then it was not included in the index at all. A separate study by the Japan International Cooperation Agency (JICA) records that the country loses P2.4 billion in potential income due to traffic jams in Metro Manila.

Here are the worst ten cities with most number of stop-starts per car a year based onthe data:

1. Jakarta, Indonesia (33,240 stops-starts per car per year)
2. Istanbul, Turkey (32, 520)
3. Mexico City, Mexico (30,840)
4. Surabaya, Indonesia (29,880)
5. St. Petersburg, Russia (29,040)
6. Moscow, Russia (28,680)
7. Rome, Italy (28,680)
8. Bangkok, Thailand (27,480)
9. Guadalajara, Mexico (24,840)
10. Buenos Aires, Argentina (23,760)

At the other end of the scale, Europe contains 8 of the 10 cities with the lowest number of stops-starts, the winner being Tampere, Finland:

1. Tampere, Finland (6,240 stops-stars per car per year)
2. Rotterdam, The Netherlands (6,360)
3-4. Abu Dhabi, United Arab Emirates (6,840)
3-4. Bratislava, Slovakia (6,840)
5. Brisbane, Australia (6,960)
6. Antwerp, Belgium (7,080)
7. Porto, Portugal (7,200)
8. Brno, Czech Republic (7,320)
9. Copenhagen, Denmark (7,440)
10. Kosice, Slovakia (7,440)

The data shows that the average driver makes around 360 stop-starts per week. This means more accelerations and decelerations, but also extended periods of idling, which not only causes pollution and wastes fuel, it reduces engine life and has an economic effect on the life of the city in terms of wasted work hours.
airpollution-index

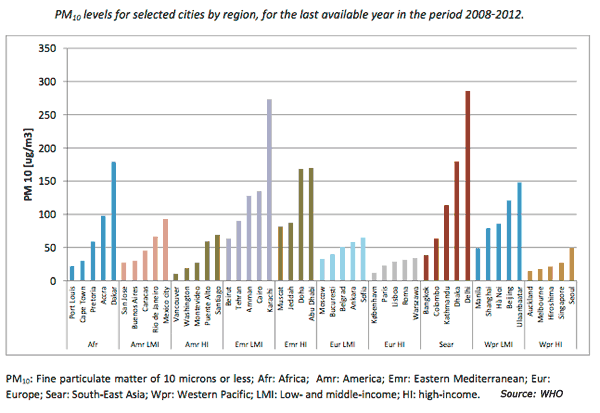
Worst air pollution in cities according to the World Health Organization. More data here.

The problem affects the poor the most. In Manila, the JICA study shows that the average low income group households have to spend no less than 20% of their monthly household income on transport, and that without intervention, traffic demand will likely increase by 13% by 2030, and transport cost will be 2.5 times higher.

How to solve the problem

The JICA study provides some insights as to how municipal authorities might begin to tackle congestion problems. These are:

  1. at the regional level, spreading economic activities to other potential growth areas including balancing development of agriculture, manufacturing, and services, while protecting prime agricultural areas for food security;
  2. avoiding urban sprawl in hazard risk areas;
  3. promoting growth of local centers (to minimize the need for travel);
  4. establishing better connectivity and an appropriate hierarchy of different transportation modes such as roads, railways, and other mass transits;
  5. planned and guided urban expansion to adjoining provinces through an integrated public transport, affordable housing for low income groups (to minimize the need for travel);
  6. retrofitting of existing urban areas in integration with public transport;
  7. expanding multi-modal public transport network;
  8. and strengthening traffic management systems with ITS.

“Intelligent Transport Systems” or ITS, includes better traffic engineering and management that requires geometric improvements, pedestrian facilities, traffic surveillance, accident prevention, traffic safety education, and traffic enforcement.

An example of ITS, as discussed in the study, requires a signal control system, travel time prediction, road maintenance, intelligent parking, incident detection, and bus scheduling assistance among others.

Worldwide, over $100 trillion in public and private spending could be saved between now and 2050 if the world were to expand public transportation, walking and bicycling in cities, according to a report by the Institute for Transportation and Development Policy and the University of California, Davis. Additionally, reductions in carbon dioxide emissions reaching 1,700 megatons per year in 2050 could be achieved.

The report was co-authored by Michael Replogle, ITDP’s managing director for policy, and Lew Fulton, co-director of the NextSTEPS Program at the Institute of Transportation Studies at UC-Davis. According to Replogle:

“Transportation, driven by rapid growth in car use, has been the fastest growing source of CO2 in the world.  An affordable but largely overlooked way to cut that pollution is to give people clean options to use public transportation, walking and cycling, expanding mobility options especially for the poor and curbing air pollution from traffic.”

The report, A Global High Shift Scenario, documents the first study to examine how major changes in transport investments worldwide would affect urban passenger transport emissions and the mobility of different income groups.

Yet cities in the developing world particularly frequntly fail to seethe above benefits and seem tobelieve that businesses need road priorities and traffic, while the contrary is the case. An example of this backward-looking mentality is Nairobi.

There, a recent report calls for road infrastructure, expanding feeder roads, dualing of major roads and constructing lay-byes. It covers a lot on the subject of inadequate parking, proposes ways to increase parking in the Central Business District, and the need for separate routes for transit vehicles.

While the study mentions the need for dedicated lanes, it surprisingly recommends that public transport vehicles should not be allowed access to the Central Business District, thus encouraging the use of private cars.

Going down this path would quickly produce more trafic and congestion. Any city requiring evience-based sensible advice should contact Embarq.

This owrganization works with mayors, city planners, and other municipal officials to provide technical assistance and institutional support for transport projects. employs the avoid, shift, improve (ASI) framework. This helps decision-makers and urban residents to avoid the need for travel motorized travel, and shift trips to the most sustainable modes, and improve conventional technologies, infrastructure, and policies.

via Which city has the world’s worst traffic jams? – Agenda – The World Economic Forum.

Posted in Air Quality, Asia, Europe, Italy, Latin America, Mexico, World News | Tagged , , , , , , , , , , , , , , , , , , , | Leave a comment

Spanish Conquest of the Incas Caused Air Pollution to Spike

A sample of Peruvian ice has revealed a surge in pollution linked to mining that wasn’t exceeded until the Industrial Revolution

The arrival of the Spanish in South America in the late 14th century heralded the destruction of the once mighty Inca empire—and triggered a surge in air pollution levels that was not exceeded until the 20th century.

The findings come from analysis of trace elements in a core sample collected in 2003 from the Quelccaya ice cap in Peru. The ice of glaciers and ice caps like Quelccaya accumulates in layers that each hold trace amounts of elements from the atmosphere. Drilling deep into a glacier and extracting a column of ice allows scientists to analyze the elements in the layers and create a record of environmental factors such as climate and pollution.
Paolo Gabrielli of Ohio State University and his colleagues measured a variety of trace elements—including lead, bismuth and arsenic—in the Quelccaya core to track the history of mining and metallurgy in South America from 793 to 1989. Those elements can be spewed into the atmosphere during the extraction and refining of various metals. To verify the ice core data, the team compared it with other types of environmental records, such as peat collected in Tierra del Fuego off the southern tip of South America, and snow from the Coats Land region of Antarctica. The research appears today in the Proceedings of the National Academy of Sciences.
The levels of trace elements were low and mostly stable before the rise of the Inca Empire in the mid-13th century. There were a few exceptions, but the researchers attribute those to volcanic eruptions in the Andes. Around 1480 came the first big spike that can be attributed to humans—a jump in bismuth levels in the ice. At that time, the Inca Empire was expanding, and the Inca began to use bismuth deposits to make a new type of bronze alloy. Archaeologists have found artifacts made of this bismuth bronze at the Inca citadel of Machu Picchu.

But it was the end of the Inca Empire that heralded the biggest increases in air pollution prior to the Industrial Revolution. After the Spanish conquered the Incas in 1533, levels of chromium, molybdenum, antimony and lead began to rise, probably because of Spanish efforts to mine the region for metals. Silver, for instance, was extracted from a mineral called argentiferous galena that also contains lead, and the refining process would have emitted metal-laden dust.
Metal deposits rose until about 1700 then remained consistent until 1830, when they began to decrease. That pattern matches South American history—the region underwent a series of wars of independence in the early 19th century. During that time, “rebel and royalist armies destroyed machinery, killed draft animals, and damaged mines and refineries,” the researchers note. “In addition, the scarcity of both [mercury] and labor for amalgamation, lack of transportation infrastructure, dearth of capital, and debilitating fiscal policies all contributed to stagnation in the mining industry during this time.”
The amounts of trace elements in the ice core continued to follow the region’s history, increasing at times when mining activities were known to increase, such as in the early 20th century. Scientists are interested in these records of past air pollution in part because there is an ongoing argument about what constitutes the start of the Anthropocene, a proposed geologic time interval marked by an increase in human activities that have left a mark on Earth. The data in the Quelccaya ice core highlights “the difficulty in defining an unequivocal onset of the Anthropocene,” says Gabrielli.
The start of the Industrial Revolution, and the resulting pollution from the rapid increase in the burning of fossil fuels, has been suggested as a possible start to the Anthropocene. But other time periods have also left behind traces. Lead from the mining and refining of metals during the Greek, Roman and Medieval periods has been found in Greenland ice cores, for instance.
That suggests “that this new epoch emerged discontinuously through space and time during human history,” Gabrielli says. “In other words, our data challenge the concept of the onset of the Anthropocene as a synchronous global discontinuity in the global geological record.”

via Spanish Conquest of the Incas Caused Air Pollution to Spike | Science | Smithsonian.

Posted in Air Quality, Latin America | Tagged , | Leave a comment

Man-made air pollution reduces Central America rainfall: study

Air pollution tied to industrialization in the northern hemisphere almost certainly reduced rainfall over Central America in new evidence that human activity can disrupt the climate, a study suggested on Monday.

“We identify an unprecedented drying trend since 1850,” the scientists wrote in the journal Nature Geoscience after studying the rate of growth since 1550 of a stalagmite found in a cave in the tiny nation of Belize.

Stalagmites are pointed rocks formed by mineral-rich water dripping from the cavern roof.

The experts, from Britain, the United States, Switzerland and Germany, said the drying in Belize “coincides with increasing aerosol emissions in the northern hemisphere” as the Industrial Revolution pushed up fossil fuel use.

The findings indicate that growing air pollution in countries such as China and India may cause further disruption, especially in Asia, to a band of tropical rains that encircles the globe around the equator and is vital to farming.

The scientists linked the drying to sun-dimming pollution because the nine biggest volcanic eruptions in the northern hemisphere since 1550, spewing out ash that veiled sunshine, also showed up as dry periods in the stalagmite’s growth.

For example, an eruption of the Laki volcano in Iceland in 1783, which has also been associated with lower water flows in the Nile, coincided with drought in Belize, they wrote.

Sun-masking pollution cools the northern hemisphere, where most industry is based. That tends to push the Intertropical Convergence Zone, a band of rain encircling the globe, south because it moves towards the warmer hemisphere, they said.

However, the scientists wrote that some unknown natural variations might also provide an explanation for the drying.

In a report published in 2013, a U.N. scientific panel said it was 95 percent likely that greenhouse gases were the main cause of recent global warming.

Many industrialized nations have introduced clean air acts since the 1970s, meaning the world has seen a shift in pollution towards fast-growing emerging nations led by China and India.

“Geographic changes in aerosol emissions should be considered when assessing potential future rainfall shifts in the tropics,” they wrote.

Lead author Harriet Ridley of Durham University told Reuters that colleagues had being examining Belize stalagmites for signs of drought about 1,000 years ago, often suggested as the cause of the collapse of the Mayan civilization.

That study is still continuing.

Baitoushan volcano, on China’s border with North Korea, had one of the biggest eruptions in history around the year 1000, according to NASA.

via Man-made air pollution reduces Central America rainfall: study | Reuters.

Posted in Air Quality | Tagged , , | Leave a comment

Understanding air pollution from biomass burners used for heating

As many places in the U.S. and Europe increasingly turn to biomass rather than fossil fuels for power and heat, scientists are focusing on what this trend might mean for air quality — and people’s health. One such study on wood-chip burners’ particulate emissions, which can cause heart and lung problems, appears in the ACS journal Energy & Fuels. The scientists say the findings could help manufacturers reduce the negative impact of this fuel in the future.

Aki Kortelainen and colleagues note that in Europe, burning wood for heat is one of the biggest sources of fine particulate emissions, contributing about the same amount of these tiny bits of pollution to the air as vehicles on a busy street. All totaled, these emissions — which have been linked to irregular heartbeats, breathing problems and nonfatal heart attacks — are associated with 350,000 premature deaths every year across Europe. In the U.S., the Centers for Disease Control and Prevention estimates that a 10 percent reduction in these particles of dust, soot and smoke could save at least 13,000 lives annually. With the rise in wood chip burners, Kortelainen’s team wanted to better understand the technology’s potential impacts on pollution and health.

The researchers measured fine particulate emissions from a wood-chip burner and found that emissions varied as the fuel went through different stages of combustion. They conclude that emissions can be reduced if burning efficiency can be maintained at a high level. The finding, they say, could help the industry design units that are less polluting and less harmful to people.

The authors acknowledge funding from the Academy of Finland Centre of Excellence program and ERA-NET Bioenergy BioHealth project.

via Understanding air pollution from biomass burners used for heating — ScienceDaily.

Posted in Air Quality, Health Effects of Air Pollution | Tagged , , , , | Leave a comment

Oxford city centre emissions fall after zone introduced

Levels of nitrogen dioxide in Oxford city centre have fallen since a Low Emission Zone (LEZ) was introduced, a preliminary study has shown.

The scheme targeting emissions from buses began in January 2014 and initial figures show that levels of pollution fell through the year.

Emissions did not exceed the average hourly target of 200 micrograms of nitrogen dioxide per cubic metre.

Oxford City Council described it as a “good result”.

The city was the second outside of London to adopt a LEZ scheme.

It encouraged buses which account for up 80% of the pollution in the city centre to reduce their emissions through measures like banning them from keeping their engines running for more than one minute at a bus stop.

Preliminary results from the first year of the initiative show that nitrogen dioxide emissions recorded by a sensor at St Aldate’s did not exceed the hourly target threshold of 200 micrograms per cubic metre at any point in 2014.

The hourly target was exceeded 12 times in 2013 and 58 times in 2012.

Nitrogen dioxide is a combustion product in exhaust gas created by road traffic.

Phil Southall, managing director of the Oxford Bus Company, said £19m had been invested in the last six years in electric hybrid buses.

Ian Halliday, air quality officer at Oxford City Council, said: “This is seen as a good result. We are now turning our attention to freight and delivery vehicles, which are the next biggest source of pollution on the roads.”

via BBC News – Oxford city centre emissions fall after zone introduced.

Posted in Air Quality, Europe, UK | Tagged , , , | Leave a comment