Smoke Across North America

While plumes of wildfire smoke from western North America have passed over the northeastern U.S. and Canada multiple times each summer in recent years, they often go unnoticed. That is because smoke that spreads far from its source typically moves at a fairly high altitude—between 5 and 10 kilometers—as winds blow it eastward.

The situation has been quite different this week, as attention-grabbing smoke poured into the eastern U.S. on July 20-21, 2021. Data from NASA’s Micro-Pulse Lidar Network (MPLNET) and Aerosol Robotic Network (AERONET) indicated that a significant amount of smoke was hovering between the land surface and 2 kilometers (1 mile) altitude. Haze darkened skies and reddened sunsets, unleashed a rash of code red and orange air quality warnings, and even left the scent of smoke in the air in some areas.

Of the large cities in the northeast, Philadelphia and New York City had some of the haziest skies. The Visible Infrared Imaging Radiometer Suite (VIIRS) on NOAA-20 captured the natural-color image of smoke over the northeast shown above on July 20.

In New York City, levels of fine particulate pollution rose above 170 on the air quality index, a level considered harmful even for healthy people. “That’s a magnitude of particle pollution that New York City hasn’t seen in more than a decade,” said Ryan Stauffer, an atmospheric scientist based at NASA’s Goddard Space Flight Center. The haze grew so thick at times that it even partially obscured the city’s iconic skyline.

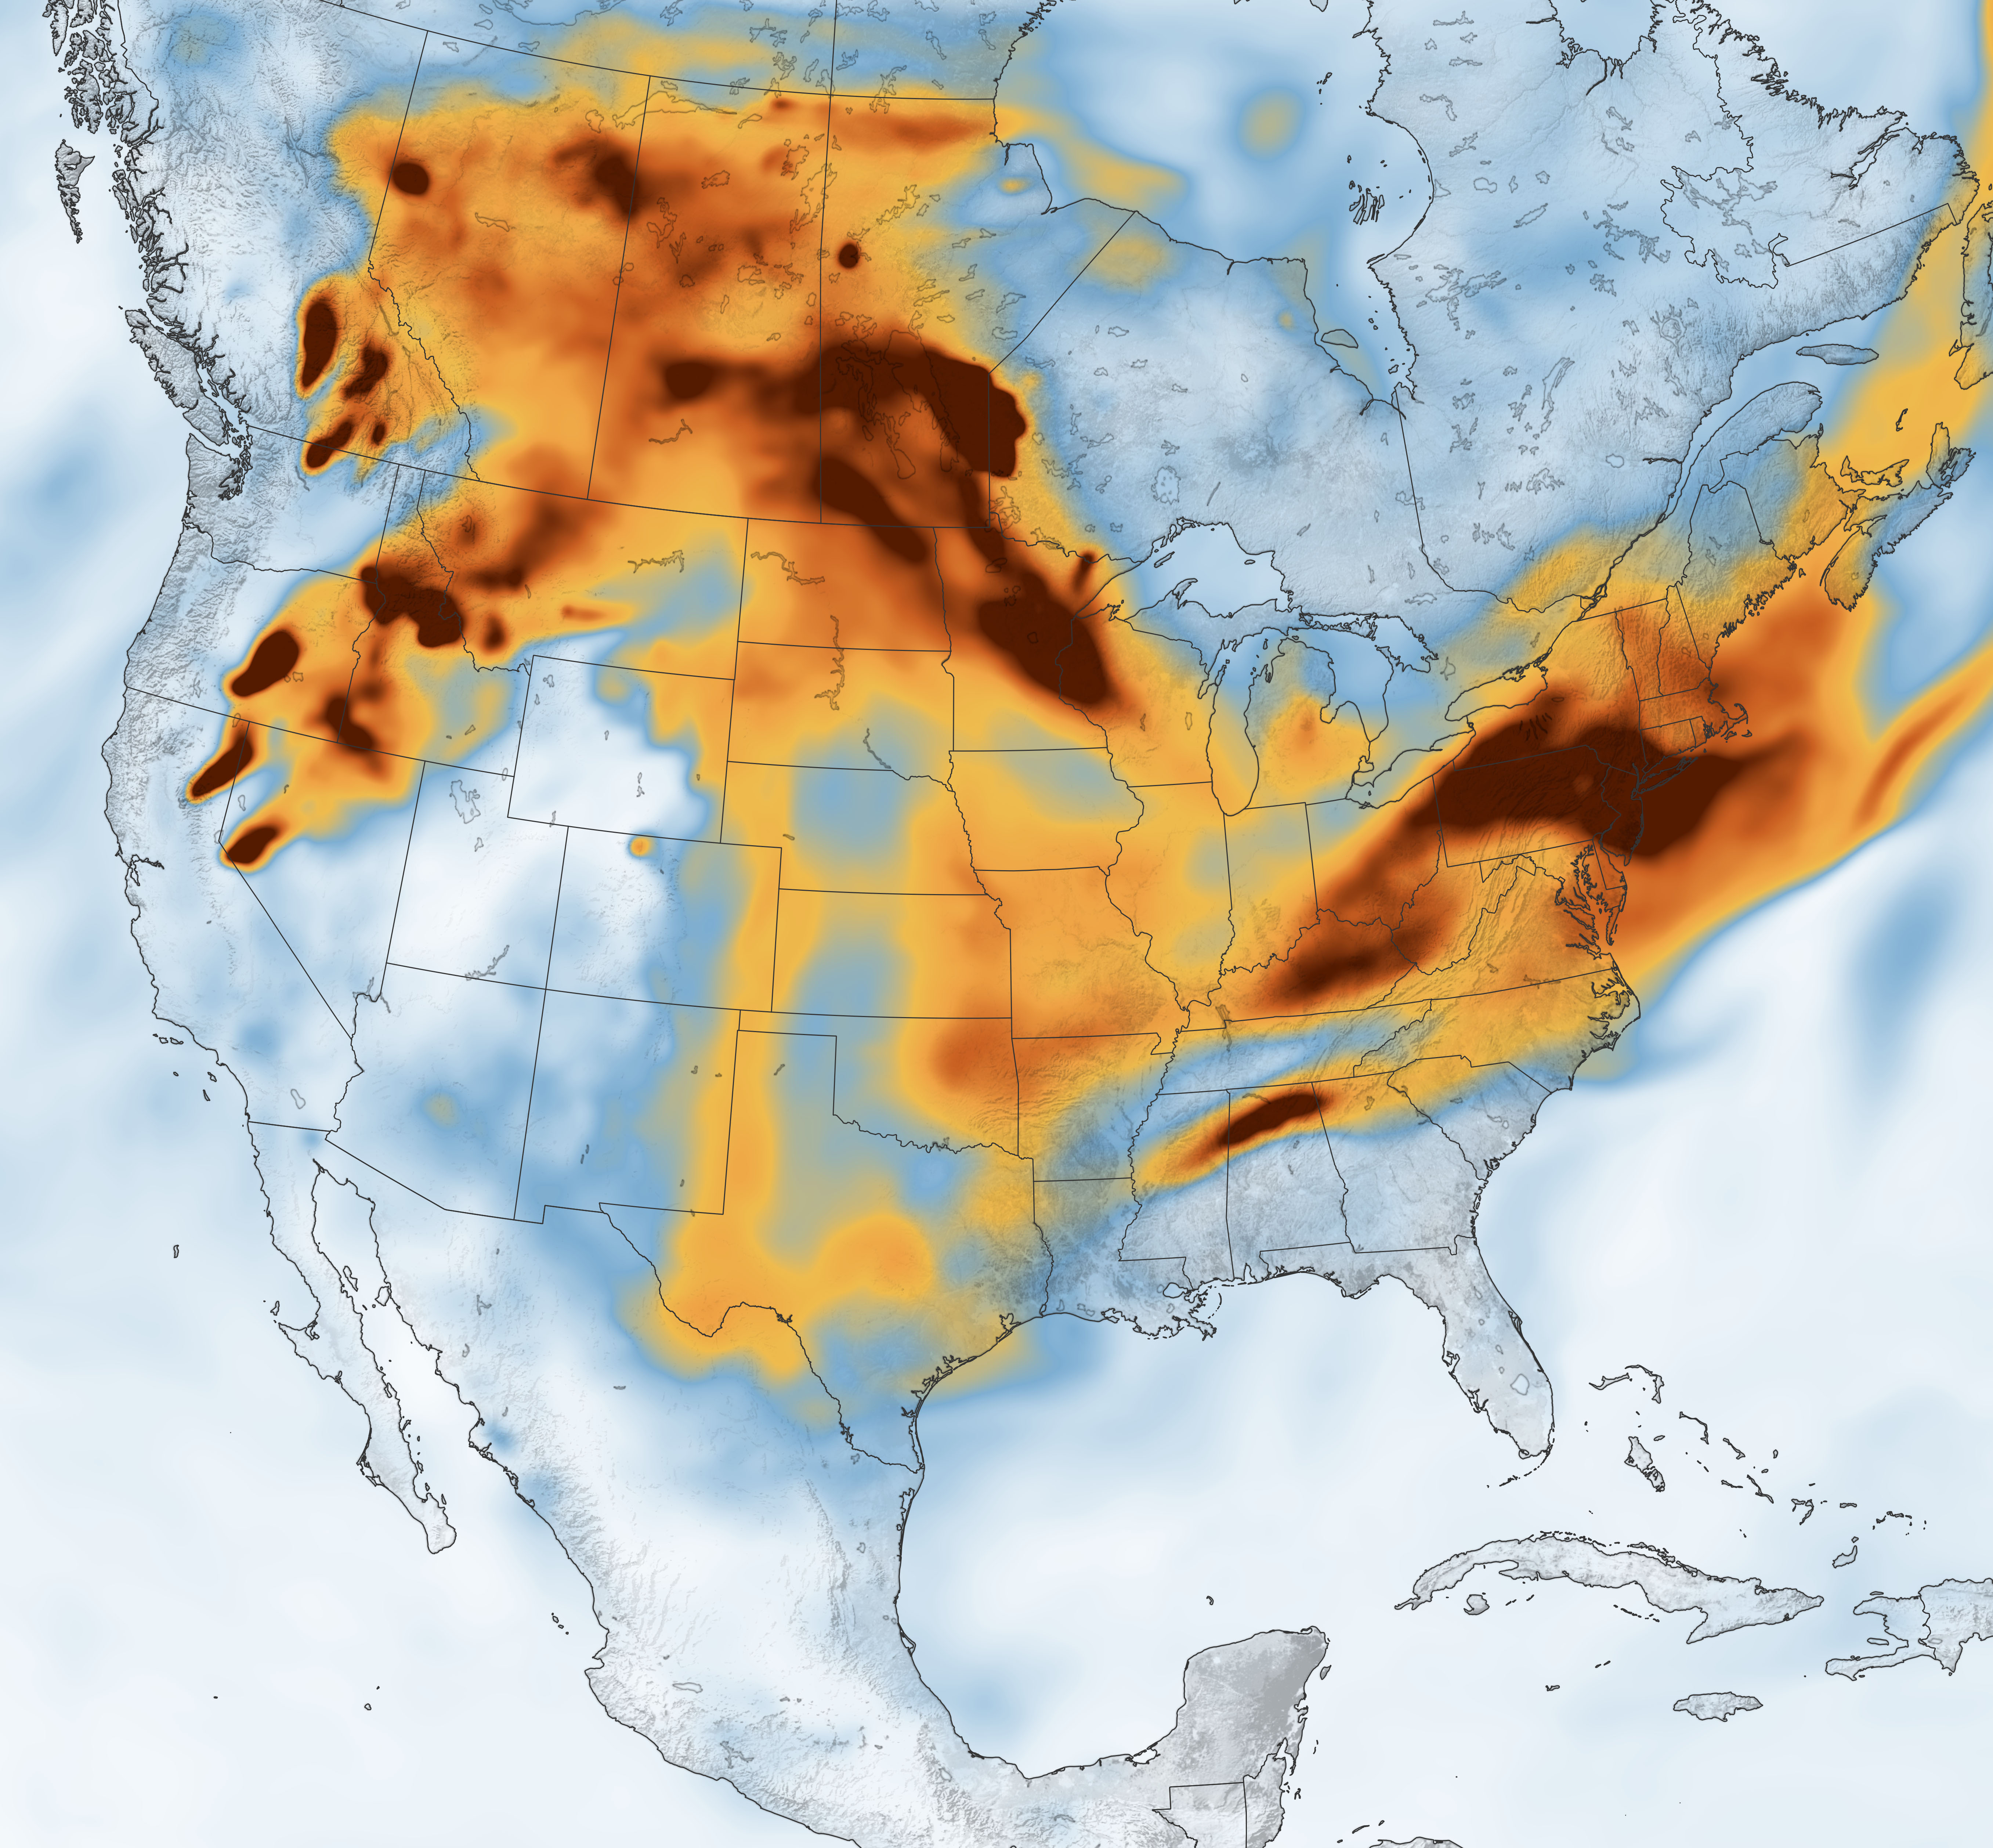
While several forest fires are raging across North America, most of the smoke that found its way to the eastern U.S. likely originated from a cluster of fires near the border of the Canadian provinces of Manitoba and Ontario, just north of Minnesota. Fires burning farther to the west in British Columbia and the Pacific Northwest of the United States may have contributed a small amount of smoke as well.

This map at the top of the page shows the concentration of black carbon particulates—commonly called soot—over North America on July 21, 2021. It is just one of several types of particles and gases found within wildfire smoke. The black carbon data come from the GEOS forward processing (GEOS-FP) model, which assimilates data from satellite, aircraft, and ground-based observing systems. To simulate black carbon, modelers include satellite observations of aerosols and fires. GEOS-FP also ingests meteorological data like air temperature, moisture, and winds to simulate the plume’s behavior.

NASA Earth Observatory images by Joshua Stevens, using GEOS-5 data from the Global Modeling and Assimilation Office at NASA GSFC and VIIRS data from NASA EOSDIS LANCEGIBS/Worldview, and the Joint Polar Satellite System (JPSS). Story by Adam Voiland.

via Smoke Across North America

Posted in Air Quality, Canada, USA, USA & Canada | Tagged , , , , , , , , , , , , , | Leave a comment

New analysis reveals global distribution of toxic pollution and climate change: And provides top-ten list of countries at highest risk — and likely most equipped to immediately begin pollution risk reduction

A new analysis of global datasets shows low-income countries are significantly more likely to be impacted by both toxic pollution and climate change — and provides a list of at-risk countries most (and least) able to immediately begin direct efforts toward pollution risk reduction, according to a study published July 7, 2021 in the open-access journal PLOS ONE by Richard Marcantonio from the University of Notre Dame, Indiana, USA, and colleagues.

In this age of the Anthropocene, it’s clear that human activities are destabilizing our planet across multiple systems. Previous research has shown that low-income countries face higher risks than high-income countries from toxic pollution and climate change; however, few studies have explored the relationship between these two risks.

To test the relationship between toxic pollution and climate change, the authors collated and analyzed three frequently used public datasets, ND-GAIN (Notre Dame Global Adaptation Index), EPI (Yale Environmental Performance Index), and GAHP (Global Alliance on Health and Pollution), using data for 176 countries from 2018.

They found a strong (rs = -0.798; 95% CI -0.852, -0.727) and statistically significant (p<0.0001) relationship between the spatial distribution of global climate risk and toxic pollution — in other words, countries most at risk for impacts of climate change were most often also the countries facing highest risks of toxic pollution. (And as other studies show, climate change and toxic pollution interact to create compounding issues: e.g. warming temperatures increase rates of heat-related illness/death as well as enhance the toxicity of environmental contaminants.) The top one-third of countries most at-risk represented over two-thirds of the world’s population, geographically concentrated in low-income countries across Africa and Southeast Asia. The authors note that the demographic, ecological, and social factors at work are interconnected and demonstrate broader patterns of inequality, and also emphasize that physical geography, local structural conditions (such as a relatively low capacity for environmental policy and enforcement), and external factors (such as foreign firms taking advantage of reduced environmental regulation) all play a role in exacerbating risks in these countries. Based on their analysis, the authors went on to create a “Target” list of top-ten countries that could provide maximum returns on any investment for risk reduction based on their risk as well as their structural capacity to enact changes (respectively: Singapore, Rwanda, China, India, Solomon Islands, Bhutan, Botswana, Georgia, the Republic of Korea, and Thailand).

The data used in this study do not capture all forms of harm or potential risk from toxic pollution and climate change — only those measured in the initial datasets. Additionally, the authors note that addressing impacts may require a finer intra-country assessment, since risks can vary widely within countries. However, the immediate findings clearly point to a need to jointly address the effects of pollution and climate change globally, while also suggesting an approach for policymakers worldwide.

The authors add: “Vast work has been done to understand the magnitude and distribution of risk from climate change and toxic pollution, separately. We wanted to know if the spatial distribution of these two types of environmental risks are similar and, unfortunately, our results say that in general they are.”

New analysis reveals global distribution of toxic pollution and climate change: And provides top-ten list of countries at highest risk — and likely most equipped to immediately begin pollution risk reduction — ScienceDaily
Posted in Africa, Air Quality, Asia, China, India, Singapore, South Korea, Thailand, World News | Tagged , , , , , , , , , , , | Leave a comment

New York air quality among worst in world as haze from western wildfires shrouds city

Smoke from wildfires in the west caused hazy skies as air quality index surged to 157 in Manhattan, well above threshold of 100

New York City air quality was among the worst in the world as cities across the eastern US were shrouded in smoke from wildfires raging several thousand miles away on the country’s west coast.

State officials in New York advised vulnerable people, such as those with asthma and heart disease, to avoid strenuous outdoor activity as air pollution soared to eclipse Lima in Peru and Kolkata in India to be ranked as the worst in the world on Tuesday.

Smoke from more than 80 major wildfires burning in the US west has caused hazy skies and plunging air quality in eastern American and Canadian cities including Philadelphia, Washington DC, Pittsburgh and Toronto, as well as New York, causing fiery sunrises and even bathing the moon in an unusual red tinge on Tuesday night.

On Wednesday morning, the air quality index surged to 157 in Manhattan, well above the threshold of 100 where health is considered to be threatened. Vulnerable people include pregnant women and the elderly, although even healthy people outside these groups can experience breathing difficulty, throat irritation and runny eyes when exposed to air this bad.

“I think it’s unusual to have this kind of haze, I don’t recall seeing this kind of thing,” said George Pope, professor of earth and environmental studies at Montclair State University, who added that he could not see Manhattan from his New Jersey office. “You can pretty much always see the skyline, at least a silhouette, if it’s a hazy day. This is, like, this is unprecedented.”

Satellite imagery shows that the smoke from the western fires has billowed into Canada and unfurled to the east, plunging states such as Minnesota into unhealthy air conditions. Winds are able to easily carry tiny sooty particles emitted from burning trees and vegetation, known as PM2.5, large distances. These PM2.5 particles can, when inhaled, burrow into the lungs and cause a variety of health problems.

“We’re seeing lots of fires producing a tremendous amount of smoke,” said David Lawrence, a meteorologist with the National Weather Service. “By the time that smoke gets to the eastern portion of the country where it’s usually thinned out, there’s just so much smoke in the atmosphere from all these fires that it’s still pretty thick.”

The smoke is set to shift away from New York in the coming days but further widespread wildfires are expected in the coming months, with people in the US west hit worst by the smoke as well as the direct threat of the flames.

David Turnbull, an activist at the US Climate Action Network who lives in Portland, Oregon, tweeted that people on the eastern seaboard should take care in the unhealthy air but also “take care of how you talk about the hazy skies. Your wonderment about it is our dread here in the west. Your curiosity is our constant fear. We live every day for months fearing the winds will shift, the fires will rage, and the smoke will come.”Topics

New York air quality among worst in world as haze from western wildfires shrouds city | New York | The Guardian

Posted in Air Quality, USA, USA & Canada | Tagged , , , , , , , | Leave a comment

‘Worst Ever’ Air Pollution Event Hits Wildfire-Plagued Siberia

A northern Siberian region plagued by unprecedented fires is experiencing one of the world’s “worst ever” air pollution events with the concentration of pollutants in the air far exceeding global standards, according to The Guardian.

The republic of Sakha’s capital of Yakutsk has been under stay-home orders due to fast-spreading wildfires that blanketed dozens of cities with smoke and prompted regional authorities to declare a state of emergency nearly a month ago. 

Atmospheric monitoring services have reported tiny particles of soot known as PM2.5 in Yakutsk at more than 40 times the World Health Organization’s recommended safe guideline. Screenshots shared by local residents showed readings 17 times worse than average in India’s and China’s most polluted cities. 

Various air-quality apps describe the situation on the ground as “hazardous” and as an “airpocalypse,” with advisories to close windows, keep babies indoors, wear masks outside and avoid outdoor exercise.

“High levels of particulate matter and possibly also chemicals including ozone, benzene and hydrogen cyanide are thought likely to make this one of the world’s worst ever air pollution events,” The Guardian reported.

Sakha, Russia’s largest and coldest region, is particularly prone to wildfires due to more than 80% of its area covered by boreal forests known as the taiga.

With winter temperatures reaching as low as minus 60 degrees Celsius, Sakha has so far this year already seen record-breaking droughts and abnormally high temperatures — ideal conditions for severe wildfires.

Sakha Governor Aisen Nikolaev attributed the wildfires to climate change, saying Tuesday “we’re living through the hottest, driest summer in the history of meteorological measurements.”

Residents painted a dire picture of living close to the wildfires, telling The Guardian that they are “both depressed and angry” amid concerns for their relatives’ health.

“The fires have touched absolutely every single person’s life in Yakutia,” said gym owner and volunteer firefighter Grigory Mochkin. “And since the smoke has gotten to Yakutsk, people are very vocal on social networks because every person’s life has been affected.”

‘Worst Ever’ Air Pollution Event Hits Wildfire-Plagued Siberia – The Moscow Times
Posted in Air Quality | Tagged , , , , , , | Leave a comment

New study examines commuter characteristics and traffic pollution exposure among commuters

New research examines commuter characteristics to better understand how factors such as departure time, frequency, and commute length are associated with exposure to air pollution. Using personal air pollution monitors, the research clustered commuters to determine whether these clusters were associated with traffic pollution exposures. The study reveals that commuters that travel during rush hour have higher overall exposure to traffic-related air pollution compared to sporadic commuters, though the difference was not statistically significant.

The link between on-road traffic and air pollution is well-known, as are the negative health impacts of pollution exposure. However, the many factors that may influence commuters’ exposure to pollutants — such as frequency, time, and duration of commute — and the overall impact of commuting remains a matter of on-going scientific discovery.

Dr. Jenna Krall, assistant professor at the George Mason University College of Health and Human Services, is using statistical methods to better understand exposure to air pollution. Krall studies how commuting patterns impact exposure to fine particulate matter (PM2.5) from various traffic-related sources such as tailpipe emissions, road salts, and brake wear.

New research from Krall and colleagues published in Environmental Research examines commuter characteristics to better understand how factors such as departure time, commute length, and number of trips are associated with exposure to PM2.5. Building on a study of 46 women’s exposure to PM2.5 using personal air pollution monitors, the new research clustered commuters to determine whether these clusters were associated with traffic pollution exposures. The new study reveals that commuters that travel to work during rush hour have higher overall exposure to traffic-related air pollution compared to sporadic commuters, though the difference was not statistically significant.

As COVID-19 infection rates decline in most areas of the country and employers weigh whether to continue work-from-home policies, studies such as this provide important insight into the role that daily commutes can play in personal air pollution exposure and the public’s health. “

This is one of the first studies to utilize in-vehicle monitoring, specifically on-board diagnostics data loggers, to understand real-world commuting behaviors for environmental health,” said Krall, “Linking these data with personal air pollution monitoring allowed us to better understand how commuter characteristics are associated with sources of air pollution exposures.”

“The current research cannot tell us whether modifying commutes, for example by avoiding highways or commuting outside of rush hour, will lower traffic pollution exposures for commuters. More research is needed to determine what changes would be effective to lower exposures,” says Krall.

Krall’s on-going research seeks to distinguish between similar sources of traffic pollution, such as pollution generated by brake wear or from tailpipe emissions, and to develop statistical methods to better estimate exposure to pollution sources.

Study participants included 46 women commuters in northern Virginia who were exposed to pollution generated by mobile vehicles, road salts, and other sources throughout a 48-hour period.

New study examines commuter characteristics and traffic pollution exposure among commuters — ScienceDaily
Posted in Air Quality | Leave a comment

Doctors issue official guidance on effects of air pollution and bushfire smoke on pregnant people

Information should serve as ‘wake-up call’ that action on climate change is needed to protect people and their children

New patient resources warning of the dangers of air pollution and bushfire smoke to pregnant people or those planning to conceive have been issued by the Royal Australian College of Obstetricians and Gynaecologists (RANZCOG), in what is thought to be a world-first.

Patients are warned to avoid exposureto air pollution on heavily trafficked roads, bushfire smoke or indoor smoke from things such as cigarettes, unflued fireplaces or incense.

The groundbreaking document explains that exposure to air pollution during pregnancy is conclusively linked to gestational diabetes, pre-term birth and growth restriction, while studies conducted in countries with high pollution also show a link to high blood pressure, miscarriage and fertility issues.

“Most airborne particles [such as PM2.5 or PM10] are not directly poisonous but can be harmful because they provoke low grade immune and stress responses in the body,” the document says.

“These include increased inflammation, increased blood glucose, changes to regulation of heart rhythms, blood vessel function, and blood clotting regulation.”

Tasmanian-based obstetrician Dr Kristine Barnden, who helped RANZCOG develop the document said she hopes the information “serves as a wake-up call to policymakers and the general public that action in the form of regulation and response to climate change is important to protect women and their children”.

“We’re aware that no one can completely escape air pollution and that some women have less options than others,” she said.

The pamphlet – which acknowledges that studies in Australia suggest low-level day-to-day exposure to air pollution may influence foetal growth – also outlines a number of actions that can be taken to mitigate risk, including use of high-efficiency particulate air (HEPA) cleaners and apps that monitor air quality, as well as wearing masks and recommends avoidance strategies such as not walking down busy roads at rush hour.

Barnden said RANZCOG first became aware of the lack of information available in 2020.

“There was a lot of concern amongst pregnant women, and a lot of talk on social media about potential risk of smoke for pregnancy, but we found there was really no resource to which we could direct women and caregivers for more information,” she said.

“We also wanted to be able to reassure women that if they are healthy and if they do take whatever steps they can to minimise the exposure to pollution, that the effects on pregnancy will actually be relatively small.”

Barnden hopes the pamphlet will raise awareness about the various sources of air pollution, because “there is certainly a lot more than just bushfires that can affect pregnancy”, and how this exposure can be minimised.

The issuing of the pamphlet follows reporting by Guardian Australia in January and March of this year, detailing how Australian public health messaging was not fully informing or explaining the risks of exposure to pregnant patients or those planning to conceive, nor did it outline concrete mitigation or minimisation strategies.

“Articles published in the Guardian did an excellent job of pulling together the available research on air pollution and pregnancy and communicating it to the public, when there was really very little else around,” said Barnden.

“The concern voiced by women and health professionals in response to these articles made it clear to us that a resource for women and health professionals was necessary.”

Doctors issue official guidance on effects of air pollution and bushfire smoke on pregnant people | Climate change | The Guardian

Posted in Air Quality, Australia & Oceania, Health Effects of Air Pollution, Medical Studies | Tagged , , , , , , , | Leave a comment

Londoners say asthma is triggered by toxic air pollution

More than 300,000 Londoners have said that their asthma is triggered by toxic air pollution as Sadiq Khan today doubles down on his commitment to expand the Ultra-Low Emission Zone.

New research from Asthma UK and the British Lung Foundation has found that more than two thirds of the 504,202 Londoners registered with asthma say that symptoms of their condition are triggered by air pollution.

The Mayor of London has reaffirmed his commitment to expanding the ULEZ in a bid to tackle the capital’s “filthy air” and has called the new research a “stark reminder” of the impacts of air pollution on vulnerable Londoners.

In just over 100 days, the ULEZ will be expanded to the North and South Circular roads, meaning that thousands more drivers will have to pay the £12.50 daily charge if their vehicles do not meet minimum emissions standards.

Sadiq Khan today invited school children suffering from asthma to attend City Hall to highlight the impact that pollution has on them, with many not able to play outside and having to leave lessons to access medication.

Mr Khan said: “As someone who lives with adult-onset asthma, I know from personal experience that London’s toxic air is damaging people’s health. I want to be the greenest mayor London has ever had – this study is a stark reminder that air pollution disproportionately affects the most vulnerable Londoners and I’m doing everything in my power to protect children, the elderly and those with respiratory conditions from our filthy air.

“In central London, the world-leading Ultra Low Emission Zone has already helped cut toxic roadside nitrogen dioxide pollution by nearly half and led to reductions that are five times greater than the national average.

“But pollution isn’t just a central London problem, which is why expanding the ULEZ later this year will benefit Londoners across the whole of the city and is a crucial step in London’s green recovery. There is no time to waste. We know pollution hits the poorest Londoners the hardest which is why I’m doing everything I can to improve the health for all Londoners.”

When the ULEZ is expanded on October 25, the new zone will cover large parts of Newham, Brent and Waltham Forest, the three boroughs with the highest rates of adult asthma hospital admissions in London.

Last year, a coroner concluded that air pollution “made a material contribution” to the death of nine-year-old Ella Adoo-Kissi-Debrah in 2013 in what was called a “landmark” decision by Sadiq Khan.

Ella, who lived near the South Circular in Lewisham, suffered from severe asthma and was hospitalised for the condition 27 times before her death.

Levels of nitrogen dioxide (NO2) near Ella’s home exceeded World Health Organisation limits, the inquest was told.

The expanded Ultra-Low Emission Zone, known as ULEX, will extend near to Ella’s home when it is introduced, with the purpose of reducing levels of NO2 in the air.

Vehicles entering the ULEX or ULEZ will have to meet minimum emissions standards – Euro 4 for petrol cars and Euro 6 for diesel cars – or drivers must pay the charge.

Euro 4 was made mandatory for new vehicles made after January 2006, while Euro 6 became mandatory for new vehicles made after September 2015.

City Hall estimates that there are 100,000 cars and 35,000 vans in the expanded zone that do not meet the minimum emissions standard.

Motorists are advised to check the TfL website to check if their vehicle is ULEZ compliant.

Londoners say asthma is triggered by toxic air pollution | Richmond and Twickenham Times
Posted in Air Quality, Asthma, Europe, Health Effects of Air Pollution, London, Research on Air Pollution in the UK, UK | Tagged , , , , , , , , , , , | Leave a comment

July 4 fireworks caused second-highest air pollution level from the holiday in Southern California in a decade

This year’s Fourth of July fireworks created the second-highest air pollution levels from the holiday in the last decade and were the highest since the Bobcat wildfire in September, the South Coast Air Quality Management District said Tuesday.

The agency said that although last week’s fireworks-related air pollution was lower than last Fourth of July, the air pollution levels have been especially high in recent years.

According to the agency, which monitors air pollution in Los Angeles, Orange, San Bernardino and Riverside counties, the average levels of fine-particle pollution, known as PM2.5, on this Independence Day and July 5 were 14% lower than during last year’s celebrations.

Levels of air pollution from the holiday this year were about 50% higher than the 10-year average from 2010 to 2019. Monitors in the valleys and inland regions over this year’s Independence Day detected unhealthy and hazardous levels of air pollution, with the highest concentration of pollutants in Ontario, the agency said.

Officials blamed the poor air quality on both personal and commercial fireworks.

“These are really levels at which everyone can be experiencing some health effects,” said Jo Kay Ghosh, a health effects officer for the air quality agency. “It could be more mild health effects such as itchy or burning eyes, a scratchy throat [or] coughing, to more serious health effects such as worsening of people’s asthma or worsening heart disease symptoms.”

The massive displays of pyrotechnics each Independence Day have long brought some of the worst air quality of the year, and not just in the Southland. A 2015 national study on the effects of the holiday’s fireworks found that average concentrations of fine-particle pollution for a 24-hour period beginning at 8 p.m. on July 4 were 42% higher than on the two days before and after that window.

July 4 fireworks caused second-highest air pollution level from the holiday in Southern California in a decade
Posted in Air Quality, USA, USA & Canada | Tagged , , , | Leave a comment