Iraqi children pay high health cost of war-induced air pollution, study finds 

Researchers identify exposure to toxic materials from explosion of munitions and burning of military waste by US army as cause of birth defects and cancers
Air pollution caused by war may be a major factor in the numbers of birth defects and cancers being reported in Iraq and other war zones, a study has suggested.

Human exposure to heavy metals and neurotoxicants from the explosion of bombs, bullets, and other ammunition affects not only those directly targeted by bombardments but also troops and people living near military bases, according to research published in the scientific journal Environmental Monitoring and Assessment.

Mozhgan Savabieasfahani, an Iranian toxicologist and lead author of the report, said “alarming” levels of lead were found in the “baby” or “deciduous” teeth of Iraqi children with birth defects, compared with similar teeth donated from Lebanese and Iranian children.

“Deciduous teeth from Iraqi children with birth defects had remarkably higher levels of Pb [lead],” she said during a recent visit to London. “Two Iraqi teeth had four times more Pb, and one tooth had as much as 50 times more Pb than samples from Lebanon and Iran.”

The study is important, because there has been scant research on how years of warfare across the Middle East have impacted local civilian populations, and data is hard to collect.

However, the few investigations that have been conducted suggest sharp increases in congenital birth defects, premature births, miscarriages and leukaemia cases in Iraq and other war zones, a finding supported by interviews with doctors.

The study supports claims that the long-term health of many thousands of former US soldiers was devastated by air pollution caused by the unregulated burning of huge volumes of military waste in hundreds of open air “burn pits” during the Iraq war.

More than 85,000 US Iraq war veterans who have signed a government registerhave been diagnosed with respiratory and breathing problems, cancers, neurological diseases, depression and emphysema since returning from Iraq. About half have stated that they were exposed to the burn pits.

The toll among soldiers has been documented in testimonies given to the US Department of Veterans Affairs and in a new book, The Burn Pits, based on interviews with 500 veterans exposed to pollution. They record how foam, electronics, metal cans, rubber tyres, ammunition, explosives, human faeces, animal carcasses, batteries, asbestos insulation and heavy metal waste were doused in jet fuel and set on fire during the Iraq war.
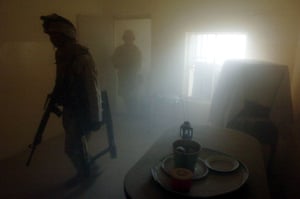
“There were 270 of these pits burning 24/7, sometimes for years. Some are still burning today. These materials converged in a toxic plume that hovered over bases, and seeped into soldiers’ sleeping and working quarters, which were often a mile or less away,” said former US Marine and Army sergeant Joseph Hickman, author of the book.

“The vets told me that they were told the smoke was a nuisance but not a hazard. Some of the pits were worse than others. One, at Balad air base, covered 10 acres and burned 50 tonnes of trash a day. There were no regulations on what could be burned, anything that was considered trash went in there.”

An air sampling study by the US Department of Defense at Balad base in 2008 detected high levels of particulate matter, polycyclic aromatic hydrocarbons, volatile organic compounds, as well as Agent Orange-type dioxins and furans.

Thousands of tonnes of herbicides containing deadly dioxins were dropped on Vietnamese and Laotian forests in the 1970s, but the health effects on veterans and local communties were not officially admitted for 27 years.

“The open-air bonfires [in Iraq] – which violated not only Environmental Protection Agency air quality standards, but the Pentagon’s own regulations – were supposed to be used only as a temporary measure, until incinerators could be put in place. But they continued to operate throughout most of these wars, with a number still running as late as 2015,” said Hickman.

Evidence of the pollution effects on Iraqi communities is barely known because little research has been done. But Savabieasfahani said the toxicological effects of the air pollution would inevitably have been damaging.

“We know that they burned pesticides, pharmaceuticals, chemicals, solvents, medical waste and toxic heavy metals. All are extremely polluting to the environment. Thick black clouds of pollution were common, day and night,” she said.

“I was alerted to the pollution when living close to Basra when the invasion started and several women at the university where I was teaching spontaneously aborted.

“But getting tissue samples out of Iraq has proved nearly impossible and little research into the pollution’s effect on people living close to the burn pits has been conducted.”

“We found very high levels of mercury, lead, titanium and various toxic metals in hair of children and parents of children with disorders or severe birth defects, showing metal contamination has happened since 2003 – with increased disorders and defects.”

She added: “We could see that when the bombing started so did the birth defects. In May 2010, 15% of 547 babies born at the [Basra] hospital had severe birth defects. This is in contrast to 2% to 4% that is normal,” she said.

Later in 2010, rates of babies being born with birth defects were as high as 30%, said Savabieasfahani. “Pollution all ends up in the body. People were breathing in high levels. Major damage was being done to people,” she said.

The full scale of the pollution from years of war in the region may never be known.

Source: Iraqi children pay high health cost of war-induced air pollution, study finds | Global development | The Guardian

Posted in Air Quality, Iraq, Middle East | Tagged , | Leave a comment

NASA’s Satellite Photos Of Rio Show Something Troubling In The Air 

Rio’s Olympic Games are in full force as 10,000 athletes from around the world traveled to the Brazilian city last week to compete, and the games are certainly off to a strong start for some. However, just days before the 2016 Olympics opening ceremony, NASA was recording imagery of Rio and the surrounding region with a satellite that passed over the city. And what NASA’s satellite imagery of Rio found reveals something troubling.

The satellite used what’s called a Multi-angle Imaging SpectroRadiometer (MISR) to collect the images, which were used to measure the level of particulate matter in the atmosphere — or in simpler terms, to estimate the level of air pollution just ahead of the games. The device measures the pollutants, which are “tiny airborne droplets or pieces of soot and dust that can end up in the lungs,” and which is a problem facing many cities around the world that struggle with poor or polluted air quality, according to NASA.

The imagery measures and displays the “aerosol optical depth” — which measures “how much incoming light from the sun is blocked” by air pollution — of the coastal waters and inland in Rio and the surrounding region. The levels varied between values of 0.15-0.25. For reference, NASA’s report suggests that a light haze corresponds to “an optical depth of 0.2.,” noting that Rio’s optical depth is “slightly elevated compared to its surroundings, most likely due to the presence of air pollution.” The highest value on the scale is 0.3 so Rio’s optical depth is definitely up there.

Check out the imagery below:

The lefthand image shows the satellite imagery of Rio on the coast, and the surrounding area — the black asterisk marks the Maracaña Stadium, where the opening ceremony was held, according to the NASA report. The report suggests that the “elevated levels of particulate matter” were present in the region for weeks leading up to the August 5 opening ceremony.

In order to host such a wide-scale sporting event, the World Health Organization (WHO) reportedly offers public health guidelines to which the hosting city is supposed to adhere. When Brazil entered the bid to host the Olympics, the country reportedly claimed that the air quality was “within the limits recommended by the World Health Organization,” according to Reuters. Reuters also noted that the claim was false in 2009 when Rio won the bid and it remains false at this point. And based on NASA’s satellite imagery, it would appear that the air quality is probably not within those limits.

In fact, according to the Reuters report on Rio’s air pollution levels, it found that based on statistics from the city’s environmental protection agency, called Inea, “Since 2011, Rio’s [particulate matter] 2.5 levels surpassed WHO’s annual limits 83 percent of the time.”

Unfortunately, and as Reuters also noted, while the Olympic athletes from around the world only have to experience Rio’s air pollution during the two-week period of competitive sporting events, the rest of the city’s occupants will still be living with high levels of particulate matter even after the games are over. And for them, it’s especially important to work toward clean air.

Image: NASA/GSFC/LaRC/JPL-Caltech, MISR Team (1)

Source: NASA’s Satellite Photos Of Rio Show Something Troubling In The Air | Bustle

Posted in Air Quality, Latin America | Tagged , , , , | Leave a comment

Map reveals which London parks have illegal pollution levels

london-pollution

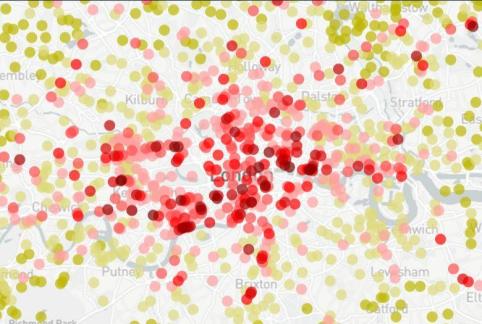
Hundreds of London’s green spaces, including Hyde Park and Regent’s Park, have potentially hazardous air pollution levels which exceed the European legal limit, according to new research.

Nearly a quarter of the capital’s open parks have over 40 micrograms of nitrogen dioxide per cubic metre of air, which represents the EU limit, with some having more than double that quantity.

Green Park, St James’s Park, Clapham Common and Kensington Gardens are among the other well-known green spaces which currently have illegal pollution levels.

The report was commissioned by data science company ASI and brought together air quality data from over 100 sensors spaced across the capital. The organisation has created a detailed pollution map, labelling parks with dangerous levels with a red circle.

According to ASI, the most polluted green space in London is Whittington Garden near St Paul’s Cathedral, which reportedly has a nitrogen dioxide rate of 99.5 micrograms per cubic metre.

Other parks making up the top five are the gardens at the rear of Langham Mansions; St Mary’s Square; Redbridge Roundabout; and the Royal Crescent Mews Amenity Area. All five spaces are situated near major tube stations.

Meanwhile the least polluted open spaces tended to be on the outskirts of the city, with Hampton Court in the south west and Dagnam Park in the north east being among the cleanest.

ASI’s Pablo Mosteiro helped produce the research to inform London’s 8.7 million population of the dangers of air pollution in parks.

“Huge numbers of Londoners are unknowingly going for walks, playing with their children and having their lunchtime sandwich in open spaces with appalling air quality,” he said.

“Our new website will allow them to see whether there are any better and cleaner alternatives nearby.”

ASI chief executive Marc Warner added: “The city’s parks are often referred to as the ‘lungs of London’. We now know that these lungs aren’t as healthy as we’d hoped.”

“The new Mayor is going to have to prioritise clean air policies so that we can make our parks and open spaces the healthy places they’re meant to be.”

Mayor of London Sadiq Khan made the improvement of the capital’s air quality a central part of his manifesto and has been praised for swiftly introducing new proposals to that end.

In June it was announced plans for an extended ultra-low emission zone to be introduced as part of a major public consultation by City Hall, after it emerged almost 10,000 Londoners die from long-term exposure to air pollution every year.

Discussing the new proposals, Mr Khan said: “Just as in the 1950s, air pollution in London today is literally killing Londoners. But unlike the smoky pollution of the past, today’s pollution is a hidden killer.

“The scale of the failure to tackle the problem is demonstrated by the failure of the Government and the previous Mayor to meet legal pollution limits.  Urgent action is now needed to ensure Londoners no longer have to fear the very air we breathe.”

Approximately 47 per cent of the capital city is thought to be green space.

It took the city just eight days in 2016 to surpass the annual cap on nitrogen dioxide concentrations, and the World Heath Organization estimates air pollution costs the UK £62bn annually.

Source: Map reveals which London parks have illegal pollution levels

Posted in Air Quality, London, UK | Tagged , , , , | Leave a comment

Tighter air pollution standards may save thousands of lives, greatly improve public health: New report includes online tool with searchable information on health risks

Reducing outdoor concentrations of two air pollutants, ozone (O3) and fine particulate matter (PM2.5), to levels below those set by the U.S. Environmental Protection Agency would likely save thousands of lives each year, result in far fewer serious illnesses and dramatically reduce missed days of school and work, according to a new analysis conducted by the American Thoracic Society and the Marron Institute of Urban Management at New York University.

In “Estimated Excess Morbidity and Mortality Caused by Air Pollution above ATS Recommended Standards, 2011-2013,” published online in the August edition of Annals of the American Thoracic Society, researchers report on the annual health benefits of meeting more protective standards recommended by the ATS for O3 and PM2.5.

They found that meeting a 0.060 parts per million (ppm) 8-hour standard for O3 rather than the EPA’s 0.070 ppm standard, and an 11 micrograms per cubic meter (μg/m3) annual standard for PM2.5, rather than the EPA’s 12 μg/m3 standard, would each year:

  • Save 9,320 lives;
  • Reduce serious health events (morbidities), such as heart attacks, hospital admissions and emergency room visits, by 21,400; and
  • Decrease “adverse impact days,” during which people may not be able to work, go to school or otherwise be physically active because of severe breathing problems, by 19,300,000 days.

“While there is information available about counties in the United States that exceed EPA air pollution standards, there has not been a similar source of information about how that air pollution actually affects the health of people living in those areas,” said lead study author Kevin Cromar, PhD, director of the Air Quality Program at the Marron Institute of Urban Management and assistant professor of population health and environmental medicine at the NYU School of Medicine.

The ATS recommended standards for O3 and PM2.5 are based on scores of national and international epidemiological, animal and human exposure studies.

The EPA sets standards for six principal air pollutants to meet its obligation under the Clean Air Act to protect the health of the American public, including vulnerable populations, by an adequate margin of safety. In addition to ozone and particulate matter, the other pollutants are lead, carbon monoxide, nitrogen dioxide and sulfur dioxide.

Dr. Cromar said that most studies have looked at only one air pollutant. By including the two most important air pollutants in the analysis, the new study “gives policy makers and local air quality managers a much better picture of what is going on.” Overall, the study found that the more protective O3standard accounted for about 75 percent of the estimated health benefits due to a greater number of metropolitan areas with O3 concentrations above the ATS recommendations.

The researchers used the same software that the EPA uses to conduct regulatory cost-benefit analysis to estimate the health benefits of more protective standards for O3 and PM2.5. Data inputted into the program came from census tract information, 19 large national or multi-city studies that assessed the health impacts of the two pollutants, and a network of air monitors that the EPA relies upon to determine if states and counties are meeting air quality.

The authors emphasized that their findings do not specifically address an individual’s health risk or the personal benefits of cleaner air, but rather assess population level health impacts. Metropolitan areas with the large populations and elevated concentrations of one or both air pollutants, they wrote, would realize the biggest improvements in public health by meeting the more protective standards.

The ten metropolitan areas that would benefit the most from more protective O3 and PM2.5 standards are:

  • Los Angeles (Long Beach-Glendale), CA: 1,341 lives saved, 3,255 fewer morbidities and 2,892,029 fewer impacted days
  • Riverside (San Bernardino-Ontario), CA: 808 lives saved, 1,416 fewer morbidities and 1,321,762 fewer impacted days
  • New York City (Jersey City-White Plains), NY-NJ: 282 lives saved, 977 fewer morbidities and 818,666 fewer impacted days
  • Phoenix (Mesa-Scottsdale), AZ: 283 lives saved, 598 fewer morbidities and 636,730 fewer impacted days
  • Pittsburgh, PA: 285 lives saved, 533 fewer morbidities and 281,858 fewer impacted days
  • Fresno, CA: 260 lives saved, 672 fewer morbidities and 390,551 fewer impacted days
  • Bakersfield, CA: 241 lives saved, 333 fewer morbidities and 220,722 fewer impacted days
  • Houston: (The Woodlands-Sugar Land), TX: 229 lives saved, 661 fewer morbidities and 636, 211 fewer impacted days
  • Cleveland (Elyria), OH: 196 lives saved, 487 fewer morbidities and 231,859 fewer impacted days
  • Cincinnati, OH-KY-IN: 173 lives saved, 298 fewer morbidities and 192,989 fewer impacted days

The ATS and Marron Institute expect to update the report annually. The report and an online tool with searchable information can be found at http://www.healthoftheair.org/. The online tool includes information about whether a metropolitan area meets EPA and ATS-recommended standards for each of the two pollutants and estimates the health benefits, for each pollutant, of meeting ATS recommended standards.

“As an organization of health care providers and researchers, we know firsthand the toll air pollution takes on people’s health, particularly the young and elderly,” said ATS President David Gozal, MD, MBA, Herbert T. Abelson professor of Pediatrics at the University of Chicago. “This report begins to quantify that toll and provides information that, we believe, should inform the setting of national air pollution standards.”

He added, “Equally important, state and local policy makers can use the online tool to better understand the nature of their air pollution problem so they can consider the best solutions for addressing their particular problem and improving the public’s health.”

Source: Tighter air pollution standards may save thousands of lives, greatly improve public health: New report includes online tool with searchable information on health risks — ScienceDaily

Posted in Air Quality, Health Effects of Air Pollution, USA & Canada | Tagged , , , , , , , , , , , , , , , , , , , , | Leave a comment

Cleveland ranks among nation’s worst metro areas for air pollution-related deaths, illnesses 

The Cleveland area leads the state in the number of deaths and serious health problems caused by air pollution, and ranks ninth worst in the country, according to a new report released today.

The Health of the Air report, compiled by the American Thoracic Society and New York University’s Marron Institute of Urban Management, found that air pollution causes as many as 9,320 deaths each year in metropolitan areas in the U.S.

The number of air pollution-related deaths are comparable to the 9,967 alcohol-related traffic deaths that occurred in the U.S. in 2014.

The Cleveland area suffered an estimated 196 deaths and 487 major health episodes from exceedingly high levels of two air pollutants – ozone and fine particulate matter – the report found.

Residents of the Cleveland area also experienced 231,859 days when air pollution sickened a person to the extent he or she could not go to work or school, or participate in other activities.

The Cleveland area’s ninth place ranking nationally for air pollution-related deaths and serious illnesses was just above the Cincinnati area, which ranked 10th. Four of the worst 10 cities are located in California, which ranked as the most-polluted state in the nation, followed by Pennsylvania, Texas and Ohio.

The Health of the Air report does not include additional chronic health problems caused by air pollution such as cancer, new-onset asthma and diabetes. Deaths from those long-term, non-fatal chronic illnesses would add to the total health burden of air pollution outcomes, the report said.

“This previously unavailable information is designed to increase public awareness and better inform public decision making with regard to the management of outdoor air pollution,” said professor Kevin Cromar of the Marron Institute, the lead author of the study.

The Health of the Air report contains findings similar to the 2016 State of the Air report compiled by the American Lung Association and released in April. That report ranked the Cleveland area as the 11th most-polluted metropolitan area in the country.

Cleveland’s biggest problem is particulate matter, the microscopic pieces of soot, smoke, dirt, dust and liquid in the air that are byproducts of burning fossil fuels at factories, power plants and in automobiles. Particulates are considered the most harmful form of air pollution because they are able to bypass the body’s defenses and be inhaled into the lungs.

Cleveland ranked 34th in the nation for particle pollution, which earned it a D grade.

The Cleveland area experienced fewer unhealthy days of high ozone levels this year than last year, but still remained the 27th most ozone-polluted in the country, which earned it an F grade.

Significant contributors to ozone pollution in Ohio include emissions from cars, trucks, trains, boats, and lawn care equipment, plus coal-burning power plants. Ozone-polluted air is especially harmful to children and older adults with asthma and other lung diseases.

Nationwide, ozone pollution has decreased as major sources of ozone-creating emissions such as coal-fired power plants and vehicles are cleaned up. Cleveland was among 16 cities that reported their lowest levels ever of particle pollution.

Source: Cleveland ranks among nation’s worst metro areas for air pollution-related deaths, illnesses | cleveland.com

Posted in Air Quality, USA & Canada | Tagged , , , , , | Leave a comment

Timaru’s air pollution standards breached for the twenty-third time 

Air pollution standards were breached yet again in Timaru.

Timaru had its 23rd high population day on Wednesday – more than the number of breaches recorded by the same time last year and the first time air quality standards were breached this month.

The latest breach recorded by Environment Canterbury’s (ECan) monitoring station at Anzac Square showed the 24 hour average PM10 concentration for August 10 was 65 micrograms of suspended particulate per cubic metre of air.

PM10 refers to particulate matter in the air that is smaller than 10 micrometres in diameter. A reading more than 50 micrograms indicates “high” pollution under the national environmental standard.

Timaru had 15 high pollution days by July 4 last year. Since 2006, there have been anywhere between 27 and 37 days of high pollution by the same day.

So far this year, the Timaru station has recorded the most high pollution days of all centres monitored by the regional council.

Kaiapoi has had seven high pollution days, Rangiora has had six, Christchurch has had five, and Ashburton has had two. The Geraldine and Washdyke stations recorded one breach this year. Waimate has not had a high air pollution night so far this year.

All but two of Timaru’s breaches this year happened in June and July.

ECan’s Canterbury Air Regional Plan, which will become operative later this year, ultimately aims for Timaru to have fewer than three high pollution nights per year.

Timaru’s PM10 readings this year:

August 10: 65mcgs (9C, -6C)

July 27: 51mcgs (15C, -2C)

July 26: 56mcgs (11C, -3C)

July 22: 51mcgs (12C, -4C)

July 12: 69mcgs (10C, -4C)

July 11: 57mcgs (8C, 4C)

July 4: 60mcgs (19C, 2C)

July 3: 88mcgs (16C, 0C)

July 2: 62mcgs (11C, -5C)

July 1: 58mcgs (9C, -4C)

June 29: 57mcgs (12C, -1C)

June 22: 67mcgs (15C, 4C)

June 21: 56mcgs (10C, 5C)

June 18: 58mcgs (11C, 0C)

June 17: 74mcgs (17C, -3C)

June 16: 55mcgs (14C, -2C)

June 9: 70mcgs (16C, -2C)

June 8: 70mcgs (10C, -5C)

June 7: 73mcgs (11C, -3C)

June 6: 59mcgs (13C, -2C)

June 4: 51mcgs (15C, -2C)

May 2: 51mcgs

March 10: 55mcgs

(Sources: Environment Canterbury, Metservice)

Source: Timaru’s air pollution standards breached for the twenty-third time | Stuff.co.nz

Posted in Air Quality, Australia & Oceania | Tagged , , , | Leave a comment

Report: London’s parks choked by potentially dangerous levels of air pollution

Even London’s parks could be facing potentially dangerous levels of air pollution, according to new research that promises to provide Londoners with detailed information on the air quality of the capital’s green spaces.

Trees and open green spaces are often seen as a cost effective mechanism for improving air quality and curbing pollution levels. But new research by London-based data science company ASI, to be released later today, reveals nearly a quarter of London’s open green spaces have unsafe levels of pollution, breaching the EU’s recommended limit for Nitrogen Dioxide of 40 micrograms per cubic metre.

The park’s found to be in breach of the target include some of London’s best-known spaces, such as Green Park, St James’s Park, Hyde Park, Clapham Common, Kensington Palace Gardens and Regent’s Park.

The top five dirtiest green spaces were named as Whittington Garden, near Cannon Street station; the gardens at the rear of Langham Mansions, near West Brompton station; St Mary’s Square, near Edgware Road tube; Redbridge Roundabout; and the Royal Crescent Mews Amenity Area, near Shepherd’s Bush station.

The research brings together air quality data for 2013 from the Greater London Authority (GLA), geographical grid references, and readings from 100 sensors across the capital that were used to cross check the GLA data.

“Huge numbers of Londoners are unknowingly going for walks, playing with their children and having their lunchtime sandwich in open spaces with appalling air quality,” said ASI Data Science Fellow Pablo Mosteiro, who produced the research. “Our new website will allow them to see whether there are any better and cleaner alternatives nearby. This was only possible, though, through the continued efforts of the GLA and others to make data publicly available.”

Marc Warner, chief executive of ASI, urged Mayor Sadiq Khan to continue his air quality policy push in a bid to improve the air in the city’s parks.

“The city’s parks are often referred to as the ‘lungs of London’,” he said. “We now know that these lungs aren’t as healthy as we’d hoped. The new Mayor is going to have to prioritise clean air policies so that we can make our parks and open spaces the healthy places they’re meant to be.”

Khan has won plaudits from green groups during his first few months in office, after launching a wide-ranging package of proposals designed to improve London’s air quality, including the early introduction of an ultra low emission zone that would impose new charges on the dirtiest vehicles, new green bus routes, and additional funding for local projects designed to tackle air pollution.

The UK government is facing ongoing legal action over its failure to bring the country into line with EU air quality standards, with ministers under mounting pressure to deliver a more ambitious national plan for tackling air pollution.

Meanwhile, in related news a group of Dutch environmentalists announced earlier this month they would sue their government over the health impacts of air pollution.


Source: Report: London’s parks choked by potentially dangerous levels of air pollution

Posted in Air Quality, Europe, London, UK | Tagged , , , , , , | Leave a comment

Traffic-related air pollutants – priority carcinogens 

Approximately one third of the Canadian population is exposed to traffic-related air pollution (TRAP) where they live (defined as areas located 500m on either side of highways or 100m on either side of major urban roads).1 Concentrations of air pollution can vary widely within a geographical area, but people living near major roads and traffic corridors can be exposed to higher levels of TRAP.2 The main route of exposure to TRAP carcinogens is inhalation.

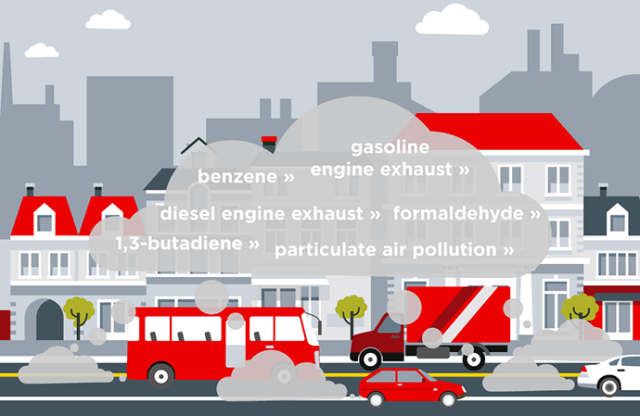
The International Agency for Research on Cancer (IARC) classifies outdoor air pollution as carcinogenic to humans, and exhaust from motor vehicles, or TRAP, is a major contributor to outdoor air pollution. Exhaust from gasoline and diesel engines is a complex mixture of substances that are formed as by-products of fuel combustion. This includes a number of known or suspected carcinogens, such as particulate matter (a mixture of a broad range of chemicals that vary in size), 1,3-butadiene, benzene, and formaldehyde, among others. TRAP also contains substances such as nitrogen oxides, sulphur dioxide, carbon monoxide, and ozone, which are linked to other health effects. This summary will focus on agents associated with cancer only.

CAREX Canada classifies carcinogens based on evaluations made by IARC and assesses potential exposure in the Canadian setting. Our environmental estimates help identify the highest priority traffic-related air pollutants linked to cancer. These include diesel and gasoline engine exhaust, as well as individual components found within this exhaust. Note that estimates are not available for a few of the substances on this list because data is lacking (i.e. particulate air pollution) or IARC has classified it recently (i.e. gasoline engine exhaust).


A number of strategies may help reduce environmental exposure to TRAP, such as decreasing traffic, improving emissions standards, and implementing land-use planning policies (for example, incorporating a buffer zone between major roadways and buildings where people live and work).2 Visit our Exposure Reduction Resources webpage for more information.

References

  1. Brauer M, Reynolds C, Hystad P. Traffic-related air pollution and health in Canada. CMAJ. 2013; 185(18): 1557-1558.
  2. Public Health Ontario. Traffic-related air pollution: Avoiding the TRAP zone. Last updated March 15, 2016.

Source: Traffic-related air pollutants – priority carcinogens — CAREX Canada

Posted in Air Quality, USA & Canada | Tagged , , , , , , , , | Leave a comment