Revealed: The inner London schools where children breathe toxic air 

Nearly one in four school children in London are being forced to breathe air so filthy that it breaches EU legal limits, a shock report warned today.

In findings which will alarm many parents, it was revealed that 328,000 pupils were at schools where nitrogen dioxide levels were above the annual permitted level.

They included more than 30,000 children in Westminster, 29,000 in Tower Hamlets, 28,800 in Southwark, 26,300 in Camden, 24,000 in Kensington and Chelsea, 23,700 in Lambeth and 20,100 in Hackney.

The authoritative research by Policy Exchange and King’s College London was published as world leaders, Prince Charles and other environmentalists met in Paris for a  climate change summit.

Fifty-eight per cent of pupils in inner London boroughs are in schools in areas with harmfully high nitrogen dioxide (NO2) levels, according to the report which emphasised the “very clear moral case” for tackling air pollution.

While the problem in outer London is not as bad, tens of thousands of pupils are still breathing toxic air, significantly blamed on diesel fumes, which scientists say will shorten many of their lives.

For Barnet the figure was 5,300, Hounslow 4,400, Enfield 3,200, Kingston 2,400 and Richmond 2,300.

A startling 979 schools out of 3,161 in London, or just over 30 per cent, are over the annual EU limit of an average of 40 micrograms per cubic metre for NO2, with some nearly twice this level. Three of the top 10 worse affected schools were boarding so many pupils would be spending a great deal of time there. The three schools were not named for legal reasons.

Interactive map: The number of school children and workers affected

Scientists say children are more vulnerable than adults to dangerous air pollution, partly as their lungs are less developed. Richard Howard, author of the report, said: “The case for tackling air pollution in London is clear. London’s air is unhealthy to breathe. Children are particularly vulnerable to unsafe levels of air pollution.”

The study measured average NO2 concentration 100 metres around a point in schools’ grounds. For very small schools it may have picked up areas immediately outside but these were included as pupils were likely to have been exposed to this air on their way to school.

Many schools have good air filtration systems inside buildings, particularly modern ones, but pupils are still likely to be at risk from pollution during break time, as they make their way between buildings and on their journeys to and from school.

The study also found that 3.8 million people, or 44 per cent of the workforce, are employed in areas of London with NO2 pollution breaking EU rules.

The worst areas are Westminster, 687,000, Camden, 368,000 and the City, 360,000. In Oxford Street, one of the capital’s pollution blackspots, the average NO2 concentration in the year to August was more than 150 micrograms per cubic metre, nearly four times the legal limit, the report said.

An eighth of the capital, or 292 sq km, suffers from NO2 levels above EU regulations, including more than two thirds of inner London, major roads and around Heathrow, according to the research which analysed data from more than 100 air quality monitoring sites.

In outer London, the air was dirtier in some more deprived communities than affluent neighbourhoods.

The death toll from filthy air in London has been officially put at more than 9,000 a year and was responsible for 3,400 hospital admissions annually.

The report states that if current and planned policies are implemented by the Mayor and Government then the average life expectancy in London could increase by six months.
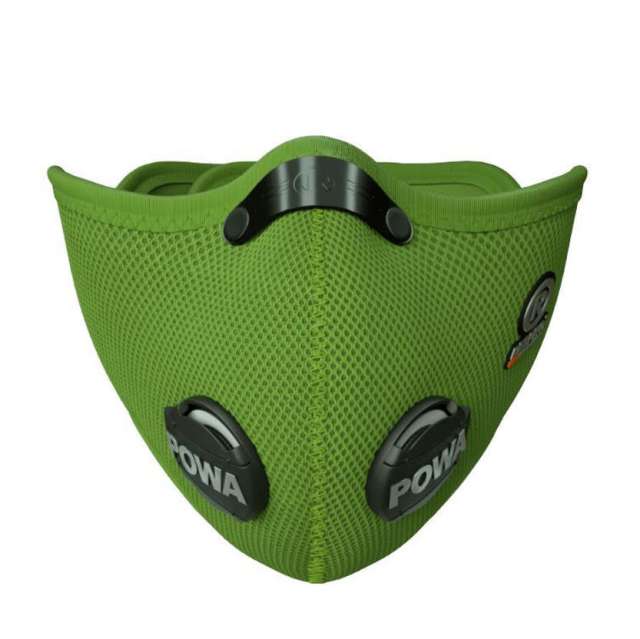
Source: Revealed: The inner London schools where children breathe toxic air | London | News | London Evening Standard

Posted in Air Quality, Europe, London, UK | Tagged , , , , , , , , , , , , , , , , , , | Leave a comment

World Pollutionwatch: Pain in Spain 

Residents of Madrid became the latest to have their daily lives disrupted by the failure to control air pollution. New emergency laws were enacted for the first time in mid-November following a finding by the EU commission that the city’s air quality plans were insufficient. Nitrogen dioxide reached almost double the World Health Organisation guidelines in central residential areas during still weather on 12 and 13 November. Urban motorway speeds were reduced from 80-90kph to 70kph (44mph) and city centre parking was restricted to residents.

The cap of polluted air that settles over Madrid is nicknamed la boina (the beret) but the city is not alone in having air pollution problems. Nitrogen dioxide limits were set in 1999 to be met by 2010 but the failure to clean diesel exhausts in real-world driving means that cities throughout Europe have yet to reach compliance.

Madrid’s emergency plans also include increased (and free) public transport. Although this means more buses, Scandinavian and London tests show that modern buses can emit less nitrogen oxides than diesel cars. This is especially the case when buses are full. At these times bus engines work harder but the hotter exhaust provides more energy for chemical reactions to scrub pollution. TheseScandinavian tests also show that diesel cars driven in cold weather (-7c) produce around three times more nitrogen oxides than they do in summer temperatures (23c). This will make it even harder for northern European cities to control their wintertime smog without restricting diesel cars.

Source: World Pollutionwatch: Pain in Spain | Environment | The Guardian

Posted in Air Quality, Europe, Spain | Tagged , , , , , , | Leave a comment

Chinese authorities boost smog alert level in Beijing 

The authorities in the Chinese capital, Beijing, have issued their highest smog warning so far this year.

The “orange level” alert declared on Sunday is the second highest possible, requiring factories to cut production.

On Sunday, some pollution readings in parts of the city reached about 17 times the level considered safe by the World Health Organisation.

Air pollution is a chronic health-risk for those living and working in the capital and other major Chinese cities.

China’s state media says the declaration of this orange level alert requires industrial plants to reduce or shut down production.

Building sites are not allowed to transport materials or waste and heavy-duty trucks are banned from the city’s roads.

Some reports suggest that visibility has fallen to a few hundred metres in some places.

At noon on Sunday, the air pollution monitor operated by the US Embassy in Beijing reported that the intensity of the poisonous, tiny particles of PM 2.5 reached more than 400 micrograms per cubic metre in some of the worst-affected areas.

The World Health Organization considers 25 micrograms per cubic metre to be a safe level.

Coal-powered industries and heating systems, as well as dust from construction sites, all contribute to the smog which has been exacerbated by humidity and a lack of wind.

A cold front, expected to arrive on Wednesday, should bring some relief.

Reliance on coal

Air pollution is a perennial problem in China’s northeast which is home to many heavy industries including coal mining.

Earlier this month, China’s state media and many residents criticised high pollution levels in the north-eastern city of Shenyang.

The People’s Daily said PM 2.5 levels exceeded 1,400 micrograms per cubic metre. Activists said that may have been the “worst ever” air quality seen in the country.

Earlier this year China’s environment ministry announced that only eight out of the country’s 74 biggest cities had passed the government’s basic air quality standards in 2014.

Most of the cities found to have the worst air were in the northeast.

China is attempting to cut pollution but still relies heavily on coal for its energy and industrial needs.

Source: Chinese authorities boost smog alert level in Beijing – BBC News

Posted in Air Quality, Asia, China | Tagged , , , , | Leave a comment

Beijing air pollution at hazardous levels

Air pollution has reached hazardous levels in the Chinese capital, Beijing, with authorities advising citizens to stay indoors.

On Saturday, the level of the poisonous, tiny particles of PM2.5 was at 391 micrograms per cubic meter, according to the US Embassy’s monitoring station in Beijing.

This is while the World Health Organization’s (WHO) guideline for maximum healthy exposure is 25. The UN body says any level of harmful particles over that figure increases risks of heart diseases, strokes and lung ailments.

Beijing, which has an estimated population of over 21 million, has been blanketed in a large gray haze, reducing visibility to a few hundred meters since Friday.

China’s Ministry of Environmental Protection earlier this week forecasted sever air pollution for the greater Beijing region, eastern Shandong Province and central Henan Province until Tuesday.

The ministry expects strong winds from the north to blow away air pollutants later next week, but it has advised the public to stay indoors until then.

Authorities reportedly blame considerable amounts of coal burning for heating as a major cause for the current air pollution.

Investigators have been dispatched to several northern cities in China to check on illegal emissions by factories that are contributing to the current high levels of air pollution.

China has already restricted industrial production and limited car usage in cities across the Asian country.

In 2013, Beijing announced it would spend 1.7 trillion yuan (267 billion dollars) in a bid to tackle air pollution. The vast sum of money was planned to be invested over a period of five years.

Source: PressTV-Beijing air pollution at hazardous levels

Posted in Air Quality, Asia, China | Tagged , , , , , , | Leave a comment

High humidity worsening air pollution, say experts 

On Thursday morning, humidity levels in the city peaked, hitting 98% in south Mumbai and 80% in the suburbs. Peaked moisture levels have high potential to hold pollutants, say experts.

According to the India Meteorological Department, the humidity in south Mumbai was almost 22% above normal. This dropped to 79% by evening. In the suburbs, the humidity fell from 80% in the morning to 55% in the evening. The humidity levels on Wednesday morning in south Mumbai and the suburbs was 87% and 77% respectively.

The minimum temperatures in the city too remained almost 3 degree Celsius above normal. The IMD recorded 26 degree Celsius at Colaba, 3.7 degree Celsius above normal and 23.4 degrees at Santacruz, a deviation of 3.3 degree Celsius. Weathermen said this could be due a day-to-day fluctuation. “There is no weather system which could affect the city so much, so this could be a result of a day-to-day fluctuation. The rain last weekend could have resulted in depositing moisture along the coastline,” said V K Rajeev, director, western region, IMD.

The high humidity levels also indicated that the air quality levels in the city took a hit as there was a thick haze in the sky on Thursday evening. According to System of Air Quality and Weather Forecasting and Research (SAFAR), Mumbai recorded an Air Quality Index (AQI) on 152 on Thursday. This is expected to worsen to 165 on Friday. AQI between 101 and 200 is acceptable for general public but moderate health concern for sensitive people.

AQI is measured for particulate matter (PM2.5 and PM10) – particles between 2.5 to 10 micrometers in size which get lodged into the respiratory system. “After the rain in Mumbai, there is lot of moisture in the air which is having high potential to hold the particles emitted from transport sector. That is the reason that PM levels are increasing in Mumbai. The wind is very calm and temperature is dropping,” said Gufran Beig, scientist, Indian Institute of Tropical Meteorology (IITM), Pune and project director, SAFAR.

Source: High humidity worsening air pollution, say experts – The Times of India

Posted in Air Quality, Asia, India | Tagged , , , , , | Leave a comment

South Africa’s air pollution hotspots

According to statistics urban air pollution is linked to up to 2 million premature deaths world-wide each year.

The World Health Organisation (WHO) air pollution database collected data on the outdoor (or ambient) air quality of 1600 cities from 91 countries. The database revealed that unsurprisingly, as the most populated city in South Africa, Johannesburg is highly polluted with the Highveld and the Vaal listed as priority area. Durban may have one of the best air pollution ratings but it is still above the global average.

Take a look at South Africa’s air pollution stats:


Source: South Africa’s air pollution hotspots | News24

Posted in Africa, Air Quality | Tagged , , , | Leave a comment

For women with diabetes, air pollution has higher heart risks 

Particle pollution like soot is a known health hazard and linked to the risk of heart disease and stroke, but women with diabetes are even more vulnerable than most people, according to a new U.S. study.

“There is a convincing literature that long-term air pollution is associated with a higher risk of cardiovascular disease,” said lead author Jaime E. Hart of Brigham and Women’s Hospital and Harvard Medical School in Boston, adding, “a number of studies of short-term air pollution exposures have suggested that individuals with diabetes are at higher risk of cardiovascular disease.”

The researchers studied 114,537 women in the decades-long Nurses’ Health Study for whom there was data on pollution exposure and health outcomes. Between 1989 and 2006 there were 6,767 cases of cardiovascular disease, 3,878 cases of coronary heart disease and 3,295 strokes in the group.

Cardiovascular disease risk rose slightly for all women with increasing exposure to the kind of tiny pollution particles that come from engine combustion, power plants and road dust.

For the women with diabetes, however, the risk increases were greater – for every additional 10 micrograms of pollution particle exposure, there was a 19 percent increase in the odds of cardiovascular disease and 23 percent increase in the odds of having a stroke.

The finest particles, known as PM 2.5, which typically come from vehicle exhaust and power plants and can enter the bloodstream after being inhaled raised risk the most. Exposure to an additional 10 micrograms of PM 2.5 pollution led to a 44 percent increase in heart disease and 66 percent increase in stroke risk, according to the results in the Journal of the American Heart Association.

The U.S. Environmental Protection Agency safe exposure limit for PM 2.5 particles outdoors is an average of 12 micrograms, or 12 millionths of a gram, per cubic meter of air over a 24-hour period. The World Health Organization puts the limit at 20 micrograms.

Pollution was also particularly harmful for women age 70 and older, those who were obese and those living in the Northeast or South. Risks were highest in relation to pollution exposure within the previous 12 months.

“There is some evidence to suggest that when women with diabetes are exposed to air pollution that they have higher levels of air pollution and oxidative stress than women without diabetes, but I think this is an area where more research is needed,” Hart told Reuters Health by email.

“Most of the evidence suggests that the results would be similar in men, but interactions with hormones can’t be ruled out,” he said.

Diabetes is an inflammatory disease, and air particles may cause further inflammation, putting more stress on the cardiovascular system, said Dr. Bart Ostro of the Air Pollution Epidemiology Section of the California Office of Environmental Health Hazard Assessment, who was not part of the new study.

“I know diabetics already have a lot to think about and worry about,” but taking the same steps they already take to manage their diabetes, like diet, exercise and medications, may reduce heart disease risk as well, Ostro told Reuters Health

“People downwind from power plants are definitely going to have a higher risk,” he said. “I don’t know if I would tell people to move immediately, but it’s a risk to be taken into account.”

Major roadways are also important pollution sources, he said.

“Given the vast literature on the adverse health effects of air pollution, I do believe that people should be concerned about air pollution exposures,” Hart said. “I think the recommendations for women with diabetes would be similar to advice for all women: don’t smoke cigarettes, eat a healthy diet, get regular exercise and, when practical, avoid being outside in areas of high pollution.”

SOURCE: bit.ly/1f4U4k9 Journal of the American Heart Association, online November 25, 2015.

Source: For women with diabetes, air pollution has higher heart risks | Reuters

Posted in Air Quality, Health Effects of Air Pollution | Tagged , , , , , | Leave a comment

Delhi November air quality threatened by Punjab farm fires 

In October and November, farmers in Punjab and Haryana burn their fields to cheaply clear paddy stubble, raising PM2.5 levels in neighbouring Delhi

Since September 2015, an ecological and public health disaster has been unfolding in Indonesia, as fires burn out of control. Such fires spread a haze over the region every autumn; this year is different only in severity and because it has caught international attention, with Indonesia surpassing China and the USA for several weeks as the world’s biggest carbon emitter.

North India – and, in particular, Delhi – has its own version of this public-health disaster unfolding right now. Once winter sets in, the PM2.5 pollution levels across Delhi are routinely more than 20 times above safe levels mandated by the World Health Organisation. In October and November, farmers in Punjab and Haryana burn their fields as this is the cheapest and easiest way to clear paddy stubble after harvest. This practice has been steadily rising since the advent of mechanised harvesting in the mid 1980s.

Wind carries the smoke across the region and particularly to Delhi. A few weeks ago NASAreleased satellite images of the plume of smoke they create.

In a recent article, our colleagues at Evidence for Policy Design showed how Delhi pollution rises and falls in patterns, over the course of the day, the week, and the year. The article showed that October – which is when the burning of paddy stubble starts – marks the onset of high winter pollution in Delhi.

High-quality satellite imagery makes it possible to examine this link more closely. The top two panels of Figure 1 below uses NASA satellite imagery from 2003 to 2015 to map how much average pollution in any given week deviates from the annual average for Delhi (top panel) and for Punjab (middle panel).

Figure 1: Punjab farm fires and percentage change in pollution from annual mean levels in Punjab and Delhi (based on data from 2003–2015)

The bottom panel of Figure 1 plots the monthly distribution of crop fires in Punjab (using the same NASA imagery): the paddy stubble burning period between the first week of October to the third week of November accounts for about 40% of crop-burning occurrences through the year. And, alongside, relative to the annual average, pollution levels increase by more than one and a half times in Delhi and roughly double in Punjab by the last two weeks of October. In contrast, stubble burning following wheat harvesting in the summer has relatively less impact, possibly because the wind and monsoon rains clear the air.

The last month has seen a flurry of policy activism around crop-burning. On November 4 the National Government Tribunal directed Delhi and four adjacent states to ban crop burning and announced fines for offenders. But there was little thought paid to what it would take to make these policies implementable; it is clear that no state government has enough agents on the ground to chase down every fire.

Rather, we need more nuanced policies. First, government – and perhaps civil society – should invest in data infrastructure that makes better information available to regulators and those on the ground. Satellite data such as that presented in this article can both help predict the onset of crop burning and identify areas where crop-burning is very high.

Figure 2 below uses the same NASA satellite imagery to map the incidence of farm-fire events across Punjab districts for the two main burning seasons. While the practice is widespread and decentralised, there is a clear geographical distinction in the distribution of paddy and wheat farm fires.

Figure 2: Autumn and spring farm fires in Punjab (based on data from 2003–2015)

More than 60% of paddy farm fires are concentrated in the five districts of Sangrur, Firozepur, Moga, Ludhiana and Patiala – and all five districts rank high on rice production. In contrast, wheat farm fires are more evenly distributed with the exception of the district of Firozepur that alone accounts for one sixth of all fires.

This regional variation suggests potentially high returns from prioritising targeted interventions in high-incidence districts. But for such interventions to be effective, it is critical that they acknowledge, and account for, individual incentives. It is difficult to get someone to give up a practice when it is others, and not them, who face the externalities of that practice.

The Punjabi farmer must breathe in smoke – but only in the short term, and this small cost is far outweighed by the benefit of having his land cleared at a low price. The negative externalities of his actions are distributed among millions of citizens living in distant Delhi and other cities in the region, where the cumulative effect of air pollution causes a staggering loss of life years.

Regulators need to identify and enforce policies that will cause farmers to internalise the externalities. If fines are to be used, the authorities have to be willing to invest the resources needed to make them implementable – for instance, provide local agents with satellite imagery that will allow them to target the big offenders.

At the same time, we need to recognize that if many fires are started by poor famers with very small plots then small fines will be politically infeasible and administratively impossible to implement.

In such situations, the high health cost of crop burning in regions further away such as Delhi creates a clear economic case for the government to assume some of the cost–for example, by subsidising cleaner ways of clearing fields and making profitable the use of agricultural wastes as fuel. There is anecdotal evidence that in some cases such policies have worked but we need rigorous pilots followed by swift large-scale rollout.

Finally, clearly not all farmers are equally reliant on crop burning across Punjab. Despite comparable paddy production, farmers in districts like Ludhiana and Patiala appear less likely to burn fields than Moga, Firozepur, and Sangrur. Can policy build on this? For instance, policymakers could use pilot projects to examine whether using social incentives such as rewarding blocks that reduce burning to below the district average can change the norm.

Today, the advent of daily satellite data makes it possible to monitor and evaluate the impact of these policies. The key is to recognise the need to design policies that align farmer incentives with the social good and then creates the data infrastructure needed to make these policies implementable.

Source: Delhi November air quality threatened by Punjab farm fires | Business Standard News

Posted in Air Quality, Asia, India | Tagged , , , , , , , | Leave a comment