Europe’s air quality can still be deadly despite progress, EEA says

Many European citizens are exposed to harmful and sometimes illegal levels of pollution despite progress to improve air quality in recent years, the European Environment Agency said in a report on Monday.

Air pollution poses the biggest environmental health risk in the European Union, where in 2018 about 379,000 premature deaths were linked to exposure to particulate matter, 54,000 to nitrogen dioxide (NO2) and 19,000 to ground-level ozone.

The EEA report said EU air quality improved in the 10 years to 2018, when premature deaths associated with particulate matter and NO2 were respectively 13% and 54% lower than in 2009.

“In most cases, people are indeed living in air quality that is much improved, and that meets the standards of the EU,” said EEA Executive Director Hans Bruyninckx.

Still, most EU citizens in urban areas are exposed to levels of some pollutants that exceed stricter World Health Organization (WHO) guidelines.

For example, 74% of the EU’s urban population is exposed to particulate matter levels exceeding WHO standards, against 4% above EU limits.

The EEA said policies have helped improve air quality by cleaning up power plants and industry – which emit particulate matter and NO2. Policies such as low-emissions zones in cities had addressed road transport, the biggest source of NO2.

The agriculture sector, which emits ammonia from fertilisers and livestock manure, has been slower to cut pollution.

The EU has already launched legal action against 18 countries for breaching air quality laws and last month took France to court for flouting its rules for more than a decade.

The EEA analysis confirmed that Europe’s air pollution plummeted in April 2020, notably in Italy and Spain, as lockdowns to contain the COVID-19 pandemic curbed polluting economic activity and slashed transport use.

Europe’s air quality can still be deadly despite progress, EEA says | Reuters
Posted in Air Quality, Europe | Tagged , , , , , , | Leave a comment

MRI Reveals Air Pollution Impact on Dementia Risk in Women

Older women exposed to higher levels of air pollution can experience a 24-percent increase in Alzheimer’s risk.

High levels of air pollution can put women in their 70s and 80s at a higher risk for developing a brain shrinkage that has been linked to Alzheimer’s disease, based on findings from their brain MRI scans.

In a study published in the Nov. 18 Neurology, investigators from the University of Southern California in Los Angeles outlined results that support putting more stringent policies in place to control air pollution levels and exposure.

“Our findings have important public health implications, because not only did we find brain shrinkage in women exposed to higher levels of air pollution, we also found it in women exposed to air pollution levels lower than those the [Environmental Protection Agency] considers safe,” said group lead Diana Younan, Ph.D., USC senior research associate and Alzheimer’s Association Research Associate in a statement released by the American Academy of Neurology. “While more research is needed, federal efforts to tighten air pollution exposure standards in the future may help reduce the risk of Alzheimer’s disease in our older populations.”

In this study, the team set out to investigate whether fine particle air pollution – microscopic particles of chemicals, smoke, dust, or other pollutants suspended in the air – can cause structural changes in the brain, leading eventually to dementia or Alzheimer’s. These particles are smaller than 2.5 micrometers – 30 times smaller than the width of a human hair, the team said.

For their investigation, funded by the National Institute on Aging, the team enrolled 712 women with an average age of 78 who did not have dementia when the study began. All women underwent an MRI brain scan at the beginning of the study, as well as five years later. And, they all provided information about their health histories, race/ethnicity, education, employment, alcohol use, smoking, and physical activity.

By using residential addresses, the team was able to determine the average air pollution exposure for each participant for the three years prior to the first MRI scan. They, then, divided the study population into four equal groups based on their exposure ranges and compared those values to the average yearly exposure of up to 12 µg/m3 that the Environmental Protection Agency considers to be safe. The study group with the lowest exposure averaged 7-to-10 micrograms of fine particle pollution per cubic meter of air (µg/m3), and the highest group averaged 13-to-19 µg/m3.

At the five-year mark, the team applied a machine learning tool designed to identify patterns of brain shrinkage that are specific to an increased Alzheimer’s disease risk to their MRI scans and gave patients a score between 0 and 1 based on how similar their brain scans were to Alzheimer’s disease patterns. Higher scores indicated a patient had experienced more brain changes in areas that were vulnerable to the disease.

According to their analysis, women’s scores increased from 0.28 at the beginning of the study to 0.44 after five years. They also determined that for each 3 µg/m3 increase in air pollution exposure, patients experienced a 0.03 change. This finding indicated a greater extent of brain shrinking over the five years that was equivalent to a 24-percent increased Alzheimer’s disease risk. That increase remained constant, Younan pointed out, even after the team adjusted for age, education, employment, cardiovascular disease, high blood pressure, physical activity, and any other factors that could affect brain shrinkage.

Overall, Younan said, this study adds to the knowledge base around the effects of air pollution on the brain.

“Our study found that women in their 70s and 80s who were exposed to the higher levels of air pollution had an increased risk of brain changes linked to Alzheimer’s disease over five years,” she said. “Our research suggests these toxins may disrupt brain structure or connections in the brain’s nerve cell network, contributing to the progression toward the disease.”

The study did have limitations, she said. Investigators only examined the brains of older women, and they only assessed regional fine particle pollution. They were also unable to assess participants’ air pollution exposure during middle-age and young adulthood. Consequently, additional research is needed.

MRI Reveals Air Pollution Impact on Dementia Risk in Women | Diagnostic Imaging
Posted in Air Quality, Health Effects of Air Pollution, Medical Studies | Tagged , , , , , | Leave a comment

NASA model reveals how much COVID-related pollution levels deviated from the norm

Since the COVID-19 pandemic began, space- and ground-based observations have shown that Earth’s atmosphere has seen significant reductions in some air pollutants. However, scientists wanted to know how much of that decline can be attributed to changes in human activity during pandemic-related shutdowns, versus how much would have occurred in a pandemic-free 2020.

Using computer models to generate a COVID-free 2020 for comparison, NASA researchers found that since February, pandemic restrictions have reduced global nitrogen dioxide concentrations by nearly 20%. The results were presented at the 2020 International Conference for High Performance Computing, Networking, Storage, and Analysis.

Nitrogen dioxide is an air pollutant that is primarily produced by the combustion of fossil fuels used by industry and transportation — both of which were significantly reduced during the height of the pandemic to prevent the novel coronavirus from spreading.

“We all knew the lockdowns were going to have an impact on air quality,” said lead author Christoph Keller with Universities Space Research Association (USRA) at NASA’s Goddard Space Flight Center in Greenbelt, Maryland. Keller works in Goddard’s Global Modeling and Assimilation Office (GMAO), which uses high-tech computer models to help track the chemistry of the ocean and the atmosphere, and forecast future climate scenarios. He says, “it was also soon clear that it was going to be difficult to quantify how much of that change is related to the lockdown measures, versus general seasonality or variability in pollution.”

No two years are exactly alike. Normal variations in weather and atmospheric circulation change the make-up and chemistry of Earth’s atmosphere. Comparing 2020 nitrogen dioxide concentrations with data from 2019 or 2018 alone would not account for year-to-year differences. But, because the NASA model projections account for these natural variations, scientists can use them to parse how much of the 2020 atmospheric composition change was caused by the COVID-19 containment measures.

Even with models, there was no predicting the sudden, drastic shifts in human behavior as the novel coronavirus — and the regulations attempting to control it — spread rapidly. Instead of trying to re-program their model with this unexpected event, Keller and his colleagues accounted for COVID-19 by having the model ignore the pandemic altogether.

The model simulation and machine learning analysis took place at the NASA Center for Climate Simulation. Its “business as usual” scenario showed an alternate reality version of 2020 — one that did not experience any unexpected changes in human behavior brought on by the pandemic.

From there it is simple subtraction. The difference between the model simulated values and the measured ground observations represents the change in emissions due to the pandemic response. The researchers received data from 46 countries — a total of 5,756 observation sites on the ground — relaying hourly atmospheric composition measurements in near-real time. On a city-level, 50 of the 61 analyzed cities show nitrogen dioxide reductions between 20-50%.

“In some ways I was surprised by how much it dropped,” said Keller. “Many countries have already done a very good job in lowering their nitrogen dioxide concentrations over the last decades due to clean air regulations, but what our results clearly show is that there is still asignificant human behavior-driven contribution.”

Wuhan, China was the first municipality reporting an outbreak of COVID-19. It was also the first to show reduced nitrogen dioxide emissions — 60% lower than simulated values expected. A 60% decrease in Milan and a 45% decrease in New York followed shortly, as their local restrictions went into effect.

“You could, at times, even see the decrease in nitrogen dioxide before the official policies went into place,” said co-author Emma Knowland with USRA at Goddard’s GMAO. “People were probably reducing their transit because the talk of the COVID-19 threat was already happening before we were actually told to shut down.” Once restrictions were eased, the decreases in nitrogen dioxide lessened, but remained below expected “business as usual” values.

Keller compared his estimates of the nitrogen dioxide decreases to reported economic numbers, namely, the gross domestic products, of the nations included in the study. According to Keller, they lined up shockingly well. “We would expect them to be somewhat related because nitrogen dioxide is so closely linked to economic activities, like people who travel and factories running,” he said. “It looks like our data captures this very well.”

The research is ongoing, and the GEOS model data used in this study are publicly available.

More information about GEOS can be found at: https://gmao.gsfc.nasa.gov/GEOS/

via NASA model reveals how much COVID-related pollution levels deviated from the norm — ScienceDaily
Posted in Air Quality | Tagged , , , | Leave a comment

Delhi AQI: This is how bad Delhi pollution was on Diwali night

With an hourly PM 2.5 concentration of 1,970 micrograms per cubic metre at 1am on the night after Diwali, the pollution readings at Vivek Vihar — a busy residential area in east Delhi — touched 33 times the safe standard, the highest in the national capital after the cracker ban across NCR was widely flouted.

The safe standard for PM 2.5 concentration is 60 micrograms per cubic metre. Mundka in west Delhi followed close behind with the hourly PM 2.5 concentration touching 1,853 micrograms per cubic metre, while Rohini in north Delhi, another bustling residential area, recorded an hourly PM 2.5 concentration of 1,798 micrograms per cubic metre, Delhi Pollution Control Committee (DPCC) data showed.

In contrast residential areas around Aurobindo Marg may have stuck more closely to the ban, with hourly readings touching a high of just 668 micrograms per cubic metre there. Similar low readings were recorded at Najafgarth (631 micrograms)., Dwarka Sector 8 (889 micrograms) and Pusa (758 micrograms), indicating some compliance in terms of the firecracker ban. All stations recorded PM2.5 readings over 10 times the safe standard on Diwali day, DPCC data shows.

Continue reading:
Delhi AQI: This is how bad Delhi pollution was on Diwali night | Delhi News – Times of India

Posted in Air Quality | Tagged , , | Leave a comment

Exposure to air pollution during fetal period, early life linked with higher blood pressure

Exposure to an urban environment characterized by high levels of air pollution and noise in areas with a high building density during the fetal period and in early childhood may contribute to higher blood pressure. This was the conclusion of a study led by the Barcelona Institute for Global Health (ISGlobal) published in Environment International. ISGlobal is an institution supported by the “la Caixa” Foundation.

To study the impact of urban exposures on the cardiovascular health of children, the research team analyzed data from 4,279 children living in six European cities (Bradford in the United Kingdom, Poitiers and Nancy in France, Sabadell and Valencia in Spain, and Heraklion in Greece). All the children were participants in the European HELIX project.

The team assessed multiple aspects of the children’s environment: initially, during the prenatal period, the place of residence of the mothers during their pregnancy, and subsequently the homes of the children themselves. Factors studied included the built environment, natural spaces, traffic, air pollution, noise, climate and level of social and economic privation. Assessing the children’s blood pressure when they were between four and five years of age allowed them to study the long-term effect of the exposures analyzed.

Analysis of the results showed that exposure to higher levels of air pollution, particularly during the first two terms of pregnancy, was associated with higher blood pressure in childhood. Specifically, a 9.1 μg/m3 increase in NO2 was associated with a 0.9 mmHg increase in diastolic blood pressure. (A healthy diastolic blood pressure in children is around 50-80 mmHg) The limit value established by the World Health Organisation to protect the population from the damaging effects of NO2 is 40 μg/m3, a threshold exceeded on a regular basis in cities like Barcelona and Madrid.

Furthermore, other characteristics of the urban environment during childhood also appear to be important. High building density is associated with higher blood pressure and good urban transport connectivity is linked to lower blood pressure.

“It is possible that these associations reflect how people move around in the city and may indicate that greater connectivity promotes physical activity in the population.” Charline Warembourg, ISGlobal researcher, first author of the study

Exposure to noise also appears to be associated with higher blood pressure in children.

Based on their analysis of the results, the authors concluded that one in every five children lives in an urban environment characterised by levels of air pollution, noise, and building density that are associated with blood pressure values higher than those observed in children not exposed to these environmental factors.

The role of urbanization in cardiovascular disease

High blood pressure is one of the chief risk factors for cardiovascular disease, a condition which is currently the leading cause of death worldwide. “Numerous studies have shown that children with higher blood pressure are more likely to develop hypertension later in life,” says Martine Vrijheid, study leader and director of ISGlobal’s Childhood and Environment Programme. “The results of this study show how important it is to identify environmental exposures that contribute to hypertension in early life, from conception onwards.”

Given the increasing urbanization of the world’s population, the role that urban design and transport plays in health is a topic of growing concern. This study assessed, for the first time, the effects on the cardiovascular health of children of numerous exposures associated with the urban environment. “Our results show that, from conception onwards, the urban environment can affect blood pressure in preschool children” Warembourg points out. “This means that a commitment to urban design and transport planning designed to reduce damaging environmental exposures has the potential to reduce the risk of cardiovascular disease in adulthood”.

Exposure to air pollution during fetal period, early life linked with higher blood pressure
Posted in Air Quality | Tagged , | Leave a comment

Italy ‘manifestly failed’ on air pollution, EU top court rules

Italy has been “systematically and persistently” exceeding daily and annual limits of particulate matter pollution permitted by EU rules, the European Court of Justice (ECJ) ruled on Tuesday (10 November).

From 2008 to 2017, “the daily and annual limit values for PM10 particulate matter were very regularly exceeded” in several Italian cities, the court said.

The ECJ concluded that Italy has “manifestly failed” to adopt timely measures to tackle pollution as required by the timeframe set out in the EU law on clean air.

Tuesday’s ruling ends the first cycle of the infringement procedure started by the European Commission against Italy in 2014.

In 2018, the European Commission also decided to refer Hungary and Romania, France, Germany and the United Kingdom to the ECJ for failing to respect limit values for nitrogen dioxide (NO2) – another air pollutant produced as a result of road traffic and other fossil fuel combustion processes.

In 2019, Italy then joined the group of countries referred to the EU top court for exceeding the legal limits NO2.

According to the European Environment Agency, Italy has the most premature deaths in the EU related to NO2 pollution.

A report of the European public health alliance published earlier this year identified that Milan, Padua, Venice, Brescia and Turin are among the top 10 EU cities with the highest costs stemming from air pollution.

It is estimated that air pollution in Italy costs €1,535 per person each year.

According to environmental lawyer Ugo Taddei from NGO ClientEarth, “this ruling is the result of years of poor management of the issue at the regional and national level – a failure which has put people’s health on the line”.

“We need to see a complete turnaround, with new regional air quality plans that slash levels of pollution in the shortest time possible, to bring air quality within legal limits,” he also said, adding that being forced to breathe dirty air in the 21st century is “unacceptable”.

In 2017, the environmentalist NGO launched legal action against Lombardy, Italy’s most-polluted region, to force local authorities to update their air quality plan.

Earlier this year, the commission concluded that a majority of member states are off-target to deliver on their air pollution reduction commitments for 2020 and 2030.

Every year, air pollution causes about 400,000 premature deaths in the EU.

While scientists are currently carrying out studies to assess the link between air pollution and Covid-19, a 2003 study on the victims of the respiratory disease SARS found that patients in regions with ‘moderate’ air pollution levels were 84 percent more likely to die than those in regions with ‘low’ air pollution.

Italy ‘manifestly failed’ on air pollution, EU top court rules
Posted in Air Quality, Europe, Italy | Tagged , , , | Leave a comment

Spell of heavy smog in Indian capital raises fears for COVID patients

Residents of the Indian capital are enduring one of the worst spells of air pollution in years, data released on Monday showed, raising the risks to city residents posed by the novel coronavirus, doctors said.

Delhi’s overall air quality index (AQI), which includes the concentration of PM2.5 particles as well as bigger pollutants, has stayed above 400, on a scale of 500, for five consecutive days, government data showed.

The tiny PM2.5 particles can cause cardiovascular and respiratory diseases including lung cancer, and pose a particular risk for people with COVID 19.

R.V. Asokan, the honorary secretary-general of the Indian Medical Association that represents 350,000 doctors, told Reuters the air pollution made people more susceptible to coronavirus infection.

“The PM2.5 particles break the nasal passage barrier, weaken the inner lining of lungs, facilitating the spread of the coronavirus infection,” Asokan said.

Doctors and researchers around the world have also reported a link between pollution and deaths in patients whose lungs are weakened by the novel coronavirus.

PM2.5 levels were 20 times the World Health Organization’s safe limit on Monday, official data showed.

The five days with an AQI above the 400 level is the longest spell of such heavy pollution in November since 2016. November is usually the worst month for pollution across north India as farmers burn off stubble in their fields and the cooler weather can trap the pollution.

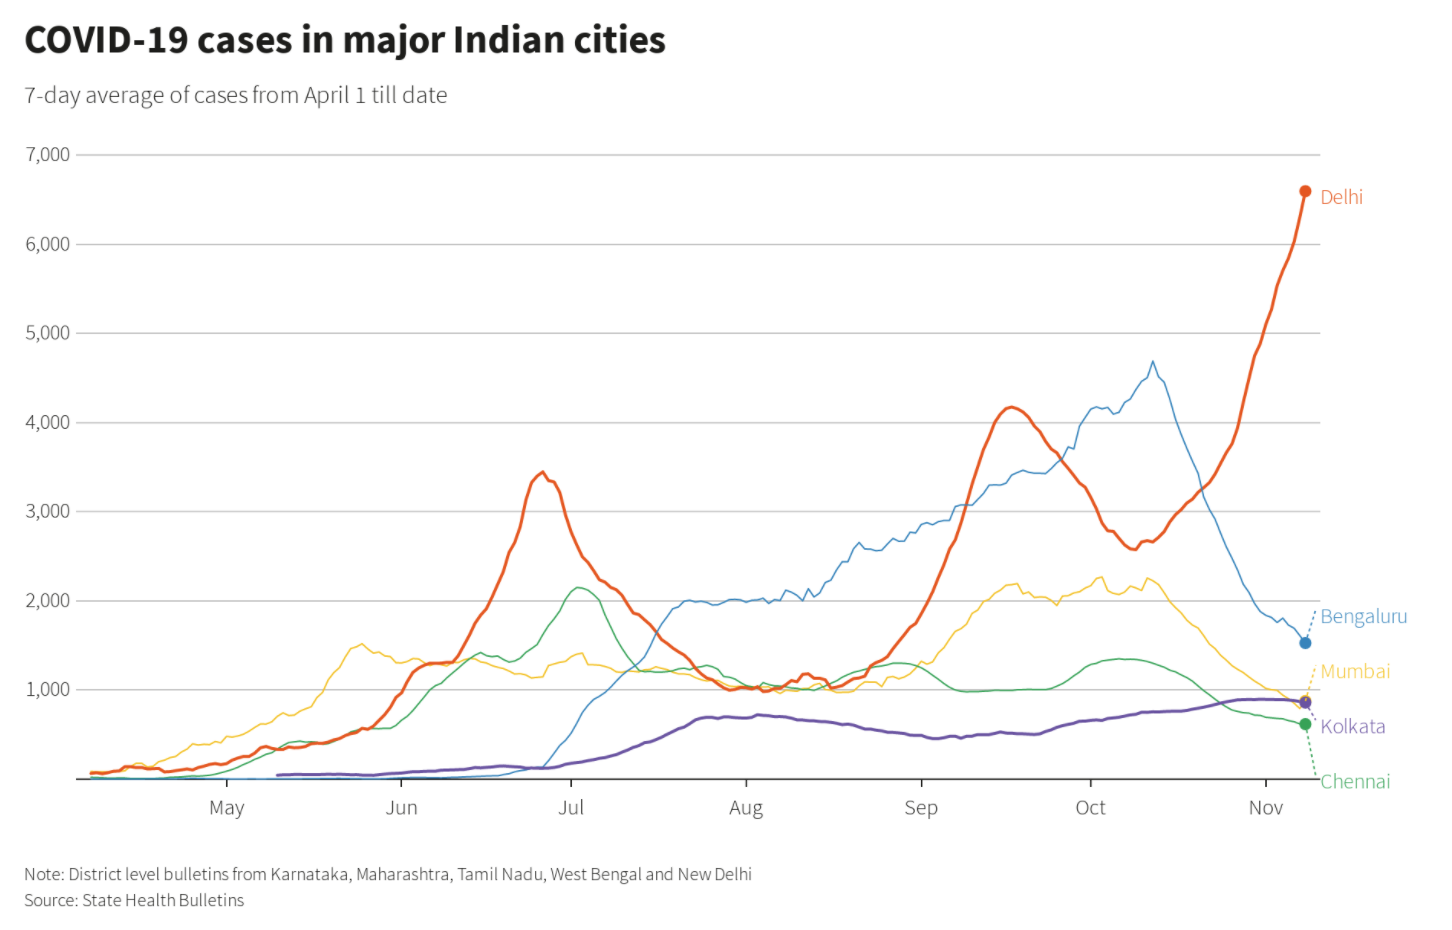
COVID-19 cases in major Indian cities COVID-19 cases in major Indian cities

Doctors in Delhi, which has reported a sharp increase in respiratory infections due to the pollution, are fearing a another jump after the Diwali festival on Sunday, which is celebrated with blizzards of smoky firecrackers, even though fireworks have been banned this year.

India’s main environment court, the National Green Tribunal, forbid the sale and use of firecrackers in the city of 20 million people, and neighbouring cities, from Monday to Dec. 1, but some people will inevitably ignore the order.

The court also told authorities to contain air pollution from all sources “in view of potential of aggravation of COVID-19”.

As well as the stubble burning, Delhi’s pollution woes are compounded by factories, vehicles and rubbish burning.

The neighbouring state of Punjab has recorded at least 50,000 crop waste fires this year, unchanged from a year ago, despite a campaign to encourage farmers to use other methods to clear stubble.

via Spell of heavy smog in Indian capital raises fears for COVID patients | Reuters

Posted in Air Quality | Tagged , , | Leave a comment

India and Pakistan dominate WHO’s air pollution database

The region contains 16 of the world’s 20 most polluted cities. Historical data sheds light on why

At this time of year, agricultural burning adds to the air pollution problems across northern India and Pakistan. The region contains 16 of the 20 most polluted cities in the World Health Organization’s global PM2.5 database. But are these the most polluted places ever recorded? Lack of measurements make historic comparisons difficult, but we have some clues.

More than 200 years ago, Benjamin Franklin was famously among the first scientists to study electricity in the atmosphere. Lightning is the most obvious manifestation, but air pollution also changes the electrical properties of our air.

Electrical measurements near Hyde Park in about 1790 suggest 18th-century London’s particle pollution was perhaps half the annual average in the most polluted cities in modern India.

By 1900, things had deteriorated. Measurements of atmospheric electricity at Kew show air pollution on the edge of London was similar to the worst Indian cities today.

When first routine measurements of particle pollution began in the 1920s, central London was approximately twice as polluted as contemporary India. Stoke-on-Trent was more than four times greater.

However, in the 1920s, the UK was home to 44 million people. About 400 million people are exposed to the poor air in north India’s Ganges River basin, making it a far larger air pollution crisis.

India and Pakistan dominate WHO’s air pollution database | Environment | The Guardian
Posted in Air Quality | Tagged , , , | Leave a comment