Traffic-related air pollution linked to DNA damage in children

Children and teens exposed to high levels of traffic-related air pollution have evidence of a specific type of DNA damage called telomere shortening, reports a study in the May Journal of Occupational and Environmental Medicine.

Young people with asthma also have evidence of telomere shortening, according to the preliminary research by John R. Balmes, MD, of University of California, Berkeley, and colleagues. They write, “Our results suggest that telomere length may have potential for use as a biomarker of DNA damage due to environmental exposures and/or chronic inflammation.”

The study included 14 children and adolescents living in Fresno, Calif. — the second-most polluted city in the United States. The researchers assessed the relationship between polycyclic aromatic hydrocarbons (PAHs), a “ubiquitous” air pollutant caused by motor vehicle exhaust; and shortening of telomeres, a type of DNA damage typically associated with aging.

As the exposure to PAHs increased, telomere length decreased in linear fashion. Children and teens with asthma were exposed to higher PAH levels than those without asthma. The relationship between PAH level and telomere shortening remained significant after adjustment for asthma and other factors (age, sex, and race/ethnicity) related to telomere length.

The study adds to previous evidence that air pollution causes oxidative stress, which can damage lipids, proteins, and DNA. Research has suggested that children may have different telomere shortening regulation than adults, which might make them more vulnerable to the damaging effects of air pollution.

“Greater knowledge of the impact of air pollution at the molecular level is necessary to design effective interventions and policies,” Dr. Balmes and coauthors conclude. With further research, telomeres could provide a new biomarker to reflect the cellular-level effects of exposure to air pollution. Telomeres might also provide new insights into the understanding how pollution exposure leads to adverse health outcomes.

Source: Traffic-related air pollution linked to DNA damage in children — ScienceDaily

Posted in Air Quality, Asthma, Health Effects of Air Pollution, Medical Studies | Tagged , , , | Leave a comment

Air you breathed yesterday was more polluted than on Diwali

Wednesday was even more polluted than Diwali with the peak level of particulate matter (PM) 2.5 crossing those of the festive day last year.

According to Central PollutionControl Board (CPCB), the 24-hour concentration of PM 2.5 at 9.30 am was 698.21 — nearly 11 times higher than the national safe standard. On October 31 (just a day after Diwali), PM2.5 peak was 690.90 micrograms per cubic metre, while the highest level on Tuesday was 349.36.

The national safe standard prescribes the upper limit of concentration of PM2.5 as 60g/m3.Similarly, the air quality index (AQI), measured over a 24-hour period, was 486 on Wednesday, which is considered as ‘severe’. AQI is an indicator of air pollution from the levels of many pollutants that include PM 2.5.

As AQI increases, people are likely to experience severe health effects. And with both PM2.5 and AQI shooting up, the CPCB listed Gurgaon as the most polluted location in the country among the 38 cities and towns it surveyed for air pollution.

Delhi’s AQI, on the other hand, was ‘moderate’ at 163 on Wednesday. Even Ghaziabad and Noida also reported AQI at 197 and 163, respectively. Other cities that generally remain polluted in the country, including Lucknow, Jodhpur and Faridabad, also reported ‘moderate’ and ‘satisfactory’ levels of air pollution.

Haryana State Pollution Control Board (HSPCB) blamed the increase in construction activities, coupled with wind speed, for the rise in the concentration of PM 2.5.

 “Sudden increase in the wind speed is responsible for the dispersal of PM2.5. Increase in construction activities is also responsible to some extent. There is a need to settle dust so that wind can’t blow it, which generally raises the level of particulate matter in the lower atmosphere,” said Jai Bhagwan, regional officer, HSPCB.

Niranjan Raje, a former member of Environment Pollution (Prevention & Control) Authority, said, “There are two major causes of an increase in air pollution — dust constantly emitting out of construction sites and an increase in the use of diesel generators. Another reason is traffic congestion due to diversions for construction of underpasses on Delhi-Gurgaon expressway.”

Source: Air you breathed yesterday was more polluted than on Diwali | Gurgaon News – Times of India

Posted in Air Quality, Asia, India | Tagged , , , , , | Leave a comment

Researchers unveil new hyper-local air pollution map

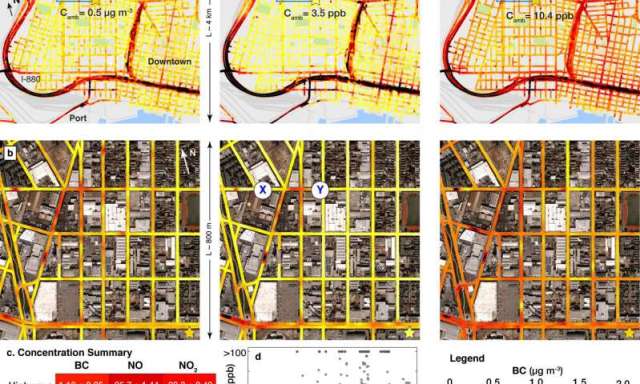
Engineering researchers at The University of Texas at Austin have developed the most detailed and extensive local map of air pollution ever produced for an urban area, using specially equipped Google Street View cars to measure air quality on a block-by-block basis. This new hyper-local mobile approach to measuring air quality, which reveals that air pollution can vary dramatically even within a single city block, could address major air quality monitoring gaps worldwide.

The research team was led by Cockrell School of Engineering assistant professor Joshua Apte in partnership with the Environmental Defense Fund (EDF), Google and Aclima, a California-based provider of environmental sensors. By integrating Aclima’s sensor system into Google Street View cars, the team mapped air pollution in 78 square miles of Oakland, California, over an entire year, collecting one of the largest data sets of air pollution ever measured of single city streets. This new technique maps urban air pollution at 100,000 times greater spatial resolution than is possible with traditional government air quality monitors. Their approach and findings were published this week in the journal Environmental Science & Technology. The study included co-authors from the University of Washington, University of British Columbia, Utrecht University, Lawrence Berkeley National Laboratory, Aclima and EDF.

The team believes that their hyper-local mobile measurement system could be implemented in many cities throughout the world, providing detailed air quality information for citizens, families, local governments and scientists. The new technique could address major air quality monitoring gaps worldwide and has the potential to transform the way air pollution is monitored in urban areas as well as shed light on the health effects on city dwellers.

Air pollution is a major global risk factor for illness and death, and the air pollution that people are breathing can be, at times, far worse than what official air quality monitors report. Most large urban areas have only one air quality monitor for every 100 to 200 square miles. In comparison, the UT Austin team’s mobile approach maps air pollution every 100 feet, or at about four to five locations along a single city block.

“Air pollution varies very finely in space, and we can’t capture that variation with other existing measurement techniques,” Apte said. “Using our approach and analysis techniques, we can now visualize air pollution with incredible detail. This kind of information could transform our understanding of the sources and impacts of air pollution.”

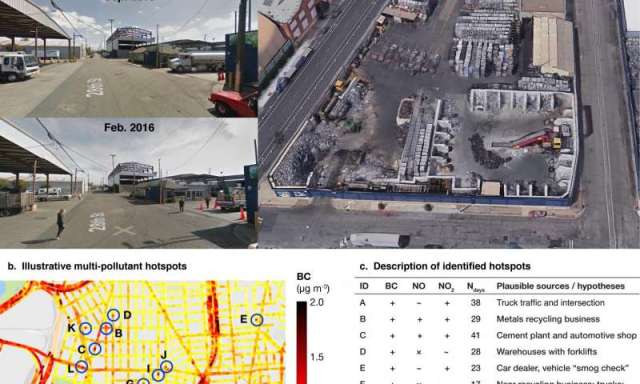
In many locations, the team’s Google cars measured air pollution levels that were several times higher than at Oakland’s official monitors. In their analysis, the researchers also identified many recurring hotspots where pollution on a single block was consistently much higher than elsewhere in a neighborhood. These pollution hotspots included the port, busy intersections, restaurants, warehouses, industrial plants and vehicle dealerships.

“What surprised us is that there are consistently locations that can be as much as six times more polluted on one end of the block than on the other,” said Kyle Messier, a UT Austin postdoctoral fellow and a co-author of the study. “Among other things, this demonstrates that people are getting disproportionate exposures of unhealthy air at some locations.”

This project is the latest phase of a partnership between EDF and Google, who have been working together since 2012 to map and measure a growing list of health and environmental risks, including hidden leaks from local natural gas systems.

“Air pollution is largely an invisible threat, one that poses especially disproportionate risks in lower-income areas like West Oakland. This new method allows us to visualize the data so communities and policymakers can identify the sources of harmful pollution and take action to improve safety and health,” said Steven Hamburg, EDF’s chief scientist.

The study’s approach was designed to be cost-effective and easily replicated. For instance, research partner Aclima designed pollution sensing systems that made it straightforward to collect high-quality air pollution data on moving vehicles day after day. Driving more than 14,000 miles, the Google cars collected 3 million measurements of nitric oxide, nitrogen dioxide and black carbon pollutants in Oakland, generating the largest urban air quality data set of its kind.

As the study’s principal investigators, UT Austin’s contributions included:

  • Designing the data collection approach and directing where the cars drove on a daily basis.
  • Developing data analysis algorithms to produce block-by-block maps of street-level air pollution from measurements made by passing Street View cars.
  • Identifying neighborhood hotspots of air pollution.
  • Determining how this approach could be efficiently scaled up to other urban areas.

In the future, Apte hopes to take this mobile air quality monitoring approach to other major cities to help formulate a hyper-local map of air pollution in the United States that could help people make more informed decisions.

“You could use this information when you’re picking a school for your kids. Is there a school with a playground that might have better air quality because your kid has asthma?” Apte said. “This hyper-local information about consistent air quality can be really useful for people, especially those who are vulnerable because of age or health condition.”

Source: Researchers unveil new hyper-local air pollution map

Posted in Air Quality | Tagged , | Leave a comment

New hyper-local air pollution map unveiled 

Engineering researchers at The University of Texas at Austin have developed the most detailed and extensive local map of air pollution ever produced for an urban area, using specially equipped Google Street View cars to measure air quality on a block-by-block basis. This new hyper-local mobile approach to measuring air quality, which reveals that air pollution can vary dramatically even within a single city block, could address major air quality monitoring gaps worldwide.

The research team was led by Cockrell School of Engineering assistant professor Joshua Apte in partnership with the Environmental Defense Fund (EDF), Google and Aclima, a California-based provider of environmental sensors. By integrating Aclima’s sensor system into Google Street View cars, the team mapped air pollution in 78 square miles of Oakland, California, over an entire year, collecting one of the largest data sets of air pollution ever measured of single city streets. This new technique maps urban air pollution at 100,000 times greater spatial resolution than is possible with traditional government air quality monitors. Their approach and findings were published this week in the journal Environmental Science & Technology. The study included co-authors from the University of Washington, University of British Columbia, Utrecht University, Lawrence Berkeley National Laboratory, Aclima and EDF.

The team believes that their hyper-local mobile measurement system could be implemented in many cities throughout the world, providing detailed air quality information for citizens, families, local governments and scientists. The new technique could address major air quality monitoring gaps worldwide and has the potential to transform the way air pollution is monitored in urban areas as well as shed light on the health effects on city dwellers.

Air pollution is a major global risk factor for illness and death, and the air pollution that people are breathing can be, at times, far worse than what official air quality monitors report. Most large urban areas have only one air quality monitor for every 100 to 200 square miles. In comparison, the UT Austin team’s mobile approach maps air pollution every 100 feet, or at about four to five locations along a single city block.

“Air pollution varies very finely in space, and we can’t capture that variation with other existing measurement techniques,” Apte said. “Using our approach and analysis techniques, we can now visualize air pollution with incredible detail. This kind of information could transform our understanding of the sources and impacts of air pollution.”

In many locations, the team’s Google cars measured air pollution levels that were several times higher than at Oakland’s official monitors. In their analysis, the researchers also identified many recurring hotspots where pollution on a single block was consistently much higher than elsewhere in a neighborhood. These pollution hotspots included the port, busy intersections, restaurants, warehouses, industrial plants and vehicle dealerships.

“What surprised us is that there are consistently locations that can be as much as six times more polluted on one end of the block than on the other,” said Kyle Messier, a UT Austin postdoctoral fellow and a co-author of the study. “Among other things, this demonstrates that people are getting disproportionate exposures of unhealthy air at some locations.”

This project is the latest phase of a partnership between EDF and Google, who have been working together since 2012 to map and measure a growing list of health and environmental risks, including hidden leaks from local natural gas systems.

“Air pollution is largely an invisible threat, one that poses especially disproportionate risks in lower-income areas like West Oakland. This new method allows us to visualize the data so communities and policymakers can identify the sources of harmful pollution and take action to improve safety and health,” said Steven Hamburg, EDF’s chief scientist.

The study’s approach was designed to be cost-effective and easily replicated. For instance, research partner Aclima designed pollution sensing systems that made it straightforward to collect high-quality air pollution data on moving vehicles day after day. Driving more than 14,000 miles, the Google cars collected 3 million measurements of nitric oxide, nitrogen dioxide and black carbon pollutants in Oakland, generating the largest urban air quality data set of its kind.

As the study’s principal investigators, UT Austin’s contributions included:

  • Designing the data collection approach and directing where the cars drove on a daily basis.
  • Developing data analysis algorithms to produce block-by-block maps of street-level air pollution from measurements made by passing Street View cars.
  • Identifying neighborhood hotspots of air pollution.
  • Determining how this approach could be efficiently scaled up to other urban areas.

In the future, Apte hopes to take this mobile air quality monitoring approach to other major cities to help formulate a hyper-local map of air pollution in the United States that could help people make more informed decisions.

“You could use this information when you’re picking a school for your kids. Is there a school with a playground that might have better air quality because your kid has asthma?” Apte said. “This hyper-local information about consistent air quality can be really useful for people, especially those who are vulnerable because of age or health condition.”

Source: New hyper-local air pollution map unveiled — ScienceDaily

Posted in Air Quality | Tagged , | Leave a comment

Marseille to cut port dues for eco-friendly ships

Marseille Fos has joined the World Ports Climate Initiative (WPCI) and is set to reduce port dues for ships performing better than required under air pollution regulations.

From July 1 this year the incentive will apply to eligible ships among the 236 container carriers and cruise vessels – a 60/40% split – that call at the port. Other sectors will be added in 2018.

The WPCI features the Environmental Ship Index (ESI), which scores atmospheric pollution on a zero to 100 scale.

Currently around 50 ports worldwide offer reduced call charges based on the ESI.

Marseille Fos reductions will apply from a score of 35 – the level attributed to ships equipped to take shoreside electrical power at berth instead of using onboard diesel generators.

The port was the first in France to announce a cold ironing facility following an agreement with Corsica and Sardinia ferry operator La Meridionale.

The company’s three ships have been equipped since January. For each vessel, CO2 and particle emissions have been cut by the equivalent of more than 3,000 vehicles per day on the 64km route from Marseille to Aix, while NOx emissions are down by the equivalent of 65,000 vehicles per day.

In a further green initiative, Marseille Fos has launched a website link to reinforce its cooperation with AirPACA, the air quality monitoring association for the Provence-Alpes-Cote d’Azur region.

Source: Marseille to cut port dues for eco-friendly ships

Posted in Air Quality, Europe, France | Tagged , , , | Leave a comment

Gurgaon air ‘deadly’ but can be fixed, says Centre for Science and Environment report

The report titled ‘Gurugram: A framework for sustainable development’ was released on Thursday ahead of the upcoming World Environment Day on June 5.

As per a report released on challenges staring at Gurgaon and possible solutions prepared by the Delhi-based Centre for Science and Environment (CSE) and Gurgaon First – under the aegis of the Municipal Corporation of Gurugram, the city is experiencing poor air quality because of large scale usage of diesel generators, dirty fuel, large scale construction and losing green areas.

The report titled ‘Gurugram: A framework for sustainable development’ was released on Thursday ahead of the upcoming World Environment Day on June 5. For the last six months, the Central Pollution Control Board (CPCB) has marked the city’s air quality as poor. To address the issue, an environment conclave was organised in the city on Thursday.

Out of all the pollutants, the suspended particulate matter (PM) 2.5 has been way above the permissible limit, which is 60 micrograms per cubic metre (µg/m³). PM2.5 is particulate matter 2.5 micrometres or less in diameter and is a major component of what constitutes air pollution. These are very fine particles and can reside in the lungs and aggravate asthma or respiratory conditions. The elderly and children are most vulnerable to adverse effects on health caused by PM2.5.

According to a study conducted by Central Pollution Control Board (CPCB), every third child in Delhi has reduced lung function and their sputum contains four times more iron-laden macrophages than those from cleaner environments, said the report.

During the discussion at the conclave, it was concluded that the city should focus on vehicular emission standard and energy efficiency to reduce air pollution.

“It is time that we should move towards solar power and reduce our dependency on diesel. At present 61% of all energy used in the city is from diesel which is a major source of air pollution,” said Vibhor Jain, Altanta Healthcare, an air quality management company.

The panelists agreed that growing dependence on personal vehicles is a major reason behind the city’s poor air quality. The number of people using public transport for their daily transportation is 17 % and about 50,000 vehicles are added on city’s roads every year, noted the study done by CSE.

“The number of cars entering Gurgaon from Delhi daily is more than three times the number of cars registered in Gurgaon in 2015. Nearly 900 trucks cross the city every day,” said Dr Anumita Roychowdhury, executive director, research and advocacy and head of the air pollution and clean transportation programme, CSE.

The environmentalists also pointed out that there is a need for more study on this issue to get a clear picture of the situation.

Similarly, Bhawani Shankar Tripathi, founding member, Mission Gurgaon Development, said, “There are no local health studies in the city to connect to public health with air pollution levels.”

Source: Gurgaon air ‘deadly’ but can be fixed, says Centre for Science and Environment report | gurgaon | Hindustan Times

Posted in Air Quality, Asia, India | Tagged , , , , | Leave a comment

Human activity has polluted European air for 2,000 years 

A new study combining European ice core data and historical records of the infamous Black Death pandemic of 1349-1353 shows metal mining and smelting have polluted the environment for thousands of years, challenging the widespread belief that environmental pollution began with the Industrial Revolution in the 1700s and 1800s.

The new study, accepted for publication in GeoHealth, a journal of the American Geophysical Union, provides evidence that the natural level of lead in the air is essentially zero, contrary to common assumptions. The research shows lead pollution from mining and smelting was detectable well before the Industrial Revolution and only when the Black Death pandemic halted those activities did lead in the air return to natural levels.

“These new data show that human activity has polluted European air almost uninterruptedly for the last ca. 2000 years,” the study’s authors write. “Only a devastating collapse in population and economic activity caused by pandemic disease reduced atmospheric pollution to what can now more accurately be termed ‘background’ or natural levels.”

The new findings could affect the current standards for lead pollution. Current public health and environmental policy deem pre-industrial lead pollution levels to be “natural” and thus presumably “safe,” but this assumption may need to be re-examined, according to the study’s authors.

Lead is one of the most dangerous environmental pollutants and is toxic to the brain at extremely low levels. No levels of lead can be considered safe in children, according to Philip Landrigan, Dean of Global Health for the Icahn School of Medicine at Mount Sinai Medical Center in New York, who was not connected to the new study.

“It’s clear that lead has lasting effects on children’s lives,” said Landrigan, who has researched lead poisoning in children and was instrumental in the implementation of abatement policies in past years.

Reconstructing past lead levels

In the new study, historians at Harvard University in Cambridge, Massachusetts, collaborated with climate scientists at the Climate Change Institute at the University of Maine in Orono. The team chose to examine past lead levels in the air because it is a dangerous pollutant and serves as a proxy for economic activity, ramping up when economies grow and tailing off when they decline.

The researchers matched new, high-resolution measurements of lead in an ice core taken from a glacier in the Swiss/Italian Alps with highly detailed historical records showing that lead mining and smelting activity plummeted to nearly zero during the plague pandemic years of 1349 to 1353.

The researchers found that lead levels declined suddenly in a section of the ice core corresponding to that four-year window of time. That decline is unique in the last 2,000 years of European history, according to Alexander More, a historian at Harvard and lead author of the new study.

“When we saw the extent of the decline in lead levels, and only saw it once, during the years of the pandemic, we were intrigued,” More said. “In different parts of Europe, the Black Death wiped out as much as half of the population. It radically changed society in multiple ways. In terms of the labor force, the mining of lead essentially stopped in major areas of production. You see this reflected in the ice core in a large drop in atmospheric lead levels, and you see it in historical records for an extended period of time.”

The researchers also found other, lesser, drops in lead accumulation in the ice core. One occurred in 1460, which the authors show may have also been due to an epidemic-related downturn. Other drops occurred during an economic slowdown in 1885 and most recently in the 1970s when abatement policies phased out leaded gasoline and other sources of lead air pollution.

More said the ice core holds much additional data, accessible due to the precision of the Climate Change Institute’s next generation laser facility and the expertise of climate scientists on the research team. Combining that data with historical sources can lead to new discoveries in the fields of climate science, the history of human and planetary health, environmental and economic history, he said.

“This research represents the convergence of two very different disciplines, history and ice core glaciology, that together provide the perspective needed to understand how a toxic substance like lead has varied in the atmosphere and, more importantly, to understand that the true natural level is in fact very close to zero,” said Paul Mayewski, Director of the Climate Change Institute at the University of Maine and co-author of the new study. “Using the ultra-high resolution ice core sampling offered through our W. M. Keck Laser Ice Facility, we expect to be able to offer new insights, previously unattainable with lower-resolution sampling, into the links between climate change and the course of civilization.”

Source: Human activity has polluted European air for 2,000 years — ScienceDaily

Posted in Air Quality, Europe, World News | Tagged , , | Leave a comment

Air pollution results in 7,700 premature deaths in Canada each year: report

Air pollution cost Canadian families an estimated $36 billion in 2015 due to premature death and illness, a new research report says.

The report, Costs of Pollution in Canada, is a compilation of scientific data on all aspects of pollution, from smog to oil spills and fertilizer use. It is being released today by the International Institute for Sustainable Development.

“The more scientists look at the costs of air pollution, the more they find those costs are large,” said Robert Smith, a senior associate at the institute and the report’s lead author.

A 2008 Canadian Medical Association study concluded that about 1,500 people die prematurely every year because of air pollution — a study once considered the gold standard, Smith said.

More recently, that study was found to have vastly underestimated the impact; new research in 2015 suggested the number of premature deaths caused by air pollution is closer to 7,700 people a year.

“We now know the costs of air pollution are much higher than we thought they were,” Smith said. “The morbidity and mortality is much worse than we thought.”

The IISD report compiles scientific research on the impacts of pollution across a number of areas, including human and animal health and costs to business and government. It includes things such as the cost to clean up contaminated sites, the impact of acid rain, the deaths of honey bees, algae blooms and oil spills.

A lot of the costs of pollution are not known at all because the research simply isn’t there, the report notes.

Pathogens in tap water add another $895 million in costs. Climate change-related heat waves cost $1.6 billion in 2015, the report says.

Heat waves are the only consequence the study priced, since there is no clear picture what portion of other events such storms and droughts can be attributed to climate change, Smith said.

Scientists have been able to attribute about 50 per cent of heat waves to climate change, and the $1.6 billion cost reflects that figure, he noted.

While much of the world is taking steps to address air pollution largely by cutting greenhouse gas emissions, there is a fear the United States is poised to rekindle the use of coal to generate electricity.

President Donald Trump has famously promised to breathe new life into the struggling U.S. coal industry, which used to be responsible for more than half of America’s power, and now produces about one-third.

Regulations on coal-fired plants have put a damper on coal production, as have market forces that made other sources more attractive, such as natural gas from fracking. Burning coal remains the largest source of air pollution in the U.S.

As Trump now ponders withdrawing from the Paris climate change agreement, Smith said fear of more coal has grown. Even though Canada isn’t going down that road, “pollution knows no boundaries.”

Toronto, which has finally started to see its air pollution levels go down, would get hit if there is suddenly a ramping-up of coal production in the Ohio Valley, Smith said.

In many ways, he added, the bright light these days is China, which recently shelved plans to open more than 100 new coal plants.

“I guess all we can, in some sense, pin our hopes on is the Chinese population — that their rising middle class isn’t going to put up with this.”

Source: Air pollution results in 7,700 premature deaths in Canada each year: report

Posted in Air Quality, USA & Canada | Tagged , | Leave a comment