China Issues ‘Red Alert’ Over Devastating Air Pollution 

It’s only the second time the country has issued the high-level warning

Beijing has issued its most severe air pollution warning for only the second time ever as unhealthy levels of smog in the city are expected to persist through Tuesday.

The red alert warning, reportedby state-owned CCTV News, comes just weeks after the first ever red alert since the country instituted the warning system in two years ago. The alert requires that some cars be kept off the road and orders a pause in work at some factories. School may also be cancelled at the discretion of local authorities.

Recent research has shown that pollution in China kills more than 1.5 million people each year (4,400 each day), amounting to 17% of the nation’s annual deaths. The red alert system is one of many changes instituted by the Chinese government to curb the number of deaths. The country has also committed to boosting production of energy from renewable sources that don’t pollute as much as the coal fired plants that dominate the country’s current energy landscape.

Source: China Issues ‘Red Alert’ Over Devastating Air Pollution | TIME

Posted in Air Quality, Asia, China | Tagged , , | Leave a comment

Beijing may miss annual goal to improve air quality due to smog 

Frequent spells of smog, which has hit Beijing four times since last month, may make it difficult for the capital to achieve its annual air quality improvement goal, a municipal official said on Sunday.

Beijing has set a target of cutting the concentration of PM2.5-particulate matter with a diameter of less than 2.5 microns that can penetrate the lungs and harm health-by 5 percent year-on-year.

Readings of the pollutants averaged 86 last year, and the figure was 74 for the first 11 months of this year.

But in recent days, when the city has twice been forced to issue the highest-level red alert warning for smog, the average reading was 241, more than three times the national safety level.

This will definitely make the annual average reading for PM2.5 higher and the pollutant-reduction target harder to achieve, said Zhang Dawei, head of the Beijing Municipal Environment Monitoring Center.

On Friday, Beijing issued its second red alert, which helped to reduce hazardous pollutants by up to 30 percent, the municipal environmental watchdog said.

“From 7 am on Saturday to 10 am on Sunday, the PM2.5 concentration was reduced by 10 to 30 percent, compared with the situation if no red alert had been issued,” Zhang said.

The peak reading for PM2.5 in Beijing as of 7 pm on Sunday was 391, recorded in the southern suburbs, data from the center showed.

The red alert took effect at 7 am on Saturday and will remain in force until midnight on Tuesday. Under the emergency measures, industrial operations are suspended and the number of vehicles on the roads reduced by half based on odd and even license plate numbers.

The smog is forecast to last until Wednesday when a strong cold front is due to sweep across northern China.

Beijing is not the only place finding it hard to achieve its air quality goal.

Baoding in Hebei province, one of the cities with the worst air quality last year, is facing the same challenge this year.

To achieve its goal, the city has decided to extend the red alert for smog for the rest of December, a government statement said.

It saw a PM2.5 reading of about 1,000 recently, forcing the authorities to take the strictest measures to date to lower pollution.

Production has been suspended or restricted at 2,045 major companies this month and work at 562 construction sites has also been halted.

Restrictions are being placed on the city’s thermal heating plants to guarantee only basic services and to cut coal consumption, which has been a major source of smog. – See more at: http://www.thejakartapost.com/news/2015/12/21/beijing-may-miss-annual-goal-improve-air-quality-due-smog.html#sthash.Ts3IwTR2.dpuf

Source: Beijing may miss annual goal to improve air quality due to smog | The Jakarta Post

Posted in Air Quality, Asia, China | Tagged , , , , | Leave a comment

Iran closes capital’s schools due to air pollution 

Iran is to close schools for two days in Tehran, state media said Saturday, following air pollution three times the acceptable level that has blanketed the city in smog.

Air quality in Iran’s capital was the worst in at least nine months this week, media said, and floating particles from car emissions were at “seven times the standard level.”

Traffic will also be limited in the center of town and some factories will be closed, according to reports.

The Air Quality Index on Monday showed an average reading of 162 — a “red status” warning that the air is unhealthy for everyone, according to World Health Organization standards.

A normal healthy level is between zero and 50.

Authorities advised the elderly, the sick and children to stay indoors and emergency services were on standby.

Peak pollution hit 180 in some areas of Tehran, where poor air is worsened due to high altitudes — between 1,100 and 1,700 meters above sea level — in a basin surrounded by mountains.

Visibility was low as a grey fog blanketed the capital, a megacity of an estimated 14 million people.

The snow-capped mountains of the Alborz range were invisible from the city center.

Exhaust fumes from five million cars make up 80 percent of Tehran’s pollution, which increases in winter as emissions fail to rise above cold air.

Iran’s government has tried to cut pollution by supplying lower emission fuel in large cities, Masoumeh Ebtekar, a vice president responsible for environmental protection, said this week.

In 2012, pollution contributed to the premature deaths of 4,500 people in Tehran and about 80,000 in the country, according to the health ministry.

Source: Iran closes capital’s schools due to air pollution – Al Arabiya News

Posted in Air Quality, Iran, Middle East | Tagged , , | Leave a comment

NASA scientists track air pollution from space 

It’s possible to track air pollution from space.

NASA scientists did that with high-resolution satellite maps. To gather the data, they used an ozone monitoring instrument on board NASA’s Aura satellite. That tool tracks atmospheric gasses.

Nitrogen dioxide levels in 2005 are shown in the top image. 2014 levels are shown in the bottom image. CREDIT NASA GODDARD MEDIA STUDIOS

The team of NASA scientists tracked emissions of nitrogen dioxide from 2005 to 2014. Nitrogen dioxide comes from cars, power plants, and industries, and it plays a major role in forming smog.

Air pollution around the Great Lakes region

Bryan Duncan is an atmospheric scientist with the NASA Goddard Space Flight Center. He says nitrogen dioxide emissions have decreased significantly around the Great Lakes region in the last decade.

He says they observed that emissions decreased by 40% in Detroit, by 42% in Chicago, and by 30% in Toronto.

“And this is mainly due to regulations — environmental regulations associated with the Clean Air Act,” Duncan says. “There were emission controls required to be placed on cars and power plants.”

The pollutants tracked 

Nitrogen dioxide doesn’t last in the atmosphere for very long, Duncan says.

“It only hangs around for a day or two,” he says. “So you can actually see where it’s being emitted.”

He says you can track other gasses this way too.

“There’s a number of gasses we can measure from space,” he says. “In particular, with the ozone monitoring instrument, we can see sulfur dioxide. That’s a major ingredient in acid rain.”

Duncan says sulfur dioxide levels also fell over the last decade.

Tracking these pollutants from space, he says, gets a little bit complicated.

On the left you can see nitrogen dioxide levels for Chicago between 2005-2007. On the right, you can see the levels between 2009-2011. CREDIT NASA GODDARD MEDIA STUDIOS

“To give a short answer, the satellite actually intercepts sunlight, then it’s reflected back from the Earth’s atmosphere and is intercepted by the satellite,” he says.

It’s that process that allows NASA scientists to determine the concentrations of different pollutants in the atmosphere.

“The satellite data is at such high quality that we can actually zoom in to the city level and we can look at spatial changes in pollution within an urban area,” Duncan says.

He says they can also see differences when power plants implement emission controls.

“We can see the level of pollution drop dramatically just in the course of a few months,” he says.

What can people do with this data?

Duncan says having access to high quality data like this is exciting for scientists. Many are using the data to monitor pollution levels around the world.

“Some people are actually using it for health studies, to understand the health effects of pollution on the local population,” he says.

And Duncan says you don’t have to be a scientist to learn from the data. He says anyone can use it to find out what pollution levels look like in their areas.

“And I think that’s the first step for many people, is just understanding what their pollutant levels are,” he says.

To find out air pollution levels near you, you can visit this NASA website.


Source: NASA scientists track air pollution from space | Michigan Radio

Posted in Air Quality | Tagged , , , , , , , | Leave a comment

How does London’s air pollution compare to other cities? 

While the UK issues a weather warning over Saharan dust cloud, over 1,500 cities around the world have a higher level of pollution

Screen Shot 2015-12-18 at 08.25.11

Despite its reputation as a smog-filled metropolis affected by air pollution, dust from the Sahara and other forms of air-borne toxicity, London is only the 2,516th worst polluted city in the world.

The most polluted city is Nyala in Sudan and other Sudanese cities make up six of the top 10 places, according to a report by the World Bank.

Developing nations are home to the most polluted cities in the world – with Pakistan, Iraq and Egypt having the most cities in the top 100 of the list.

Screen Shot 2015-12-18 at 08.25.59

New York and Berlin fared worse than the British capital, in 2445th and 2312nd places respectively, but Manchester, Edinburgh and Paris all recorded cleaner air than London.

The highest ranked European city is Georgia’s capital Tsbilsi – having the 268th most polluted air in the world.

The report was based on a pool of 3,226 world cities with populations larger than 100,000, as well as including national capitals.

However, a smaller report by the World Health Organization this year ranked London 940th out of 1622 cities.

It took measurements from “monitoring stations located in urban background, residential, commercial and mixed areas” and also including measuring PM2.5 (fine particulate matter).

Indian city Delhi takes the dubious honour of number one spot, according to the data.

Residents of the Indian capital, on an average day, breathe air that contains almost 10 times as many fine particles as the London mean.

Nonetheless, it is still significantly more than the WHO annual mean guideline.

Screen Shot 2015-12-18 at 08.26.51

London does, however, still earn its nickname as “The Big Smoke” – because although PM2.5 is responsible for the greatest number of deaths worldwide, nitrogen dioxide kills more people in London, responsible for 5,879 deaths.

Nitrogen dioxide was a key factor of VW’s attempt to rig its emissions statistics.

The capital’s shopping hotspot Oxford Street was last year named the most polluted street on earth.

Simon Birkett, founder of the Clean Air in London campaign, said: “With most of the breaches of NO2 [nitrogen dioxide] laws in London due to diesel vehicles on Transport for London roads, it is clear the mayor has failed to help boroughs comply with these limits.”

Sian Berry, the Green Party’s London Mayoral candidate, added: “Simply not enough is being done to invest in green industries throughout the UK. But there are robust moral and economic arguments to do so.”

Last week, 195 countries met in Paris to make an historic agreement to fight climate change, aiming to abandon fossil fuels this century and to limit global warming to 2°c.

More than three million people die prematurely each year from air pollution and this figure is set to double by 2050.

Source: How does London’s air pollution compare to other cities? – Telegraph

Posted in Air Quality, Europe, Iraq, London, UK | Tagged , , , , , , , , , , , , , , , , , , , , | Leave a comment

Illegal air pollution will blight many UK cities for at least five years 

Government plan to improve air quality will still leave people in dozens of cities, including London, Birmingham, Leeds, Liverpool, Cardiff and Edinburgh, breathing toxic air until at least 2020

Dozens of UK cities including London, Birmingham, Leeds, Liverpool, Cardiff and Edinburgh will still be in breach of EU limits on air pollution for at least the next five years, despite an air quality action plan issued by the government on Thursday.

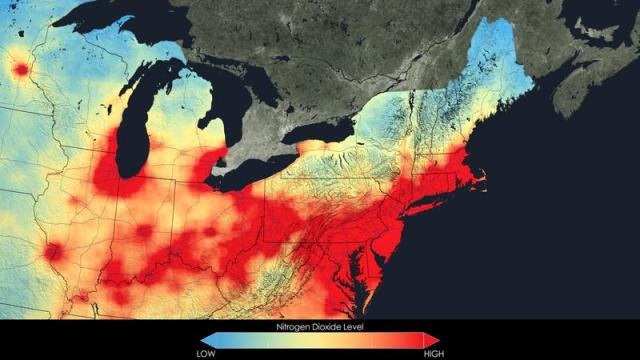
The plan is a response to a supreme court ruling in April on the government’s failure to meet European limits of harmful NOx gases, which are mostly caused by diesel traffic and blamed for nearly 9,500 premature deaths each year in London alone.

But the blueprint for cutting NOx lets privately-owned passenger cars off the hook by making them exempt, and only includes so-called clean air zones for five cities, in addition to one already planned in London.

Alan Andrews, a lawyer for ClientEarth, the NGO which won the supreme court case, said: “These are better than the draft plans [published in September] but they’re still not good enough. They need to go much further and much faster, and we’ll be going back to court.”

He added: “The original deadline for compliance was 2010. The supreme court ordered plans to achieve compliance as soon as possible, yet the government is acting as if 2020 is somehow okay. Every year that goes by, thousands more people will die or be made seriously ill.”

Under the plan, so-called clean air zones will be introduced in Birmingham, Leeds, Nottingham, Derby and Southampton by 2020. The owners of the dirtiest buses, coaches, lorries and taxis will have to pay a charge to enter the zones, but newer and cleaner models will be exempt.

However, privately-owned passenger cars, which make up 88% of the UK’s motor fleet , will also be exempt from paying a charge. In pollution hotspots, vehicles are responsible for around 80% of NOx emissions.

The plan projects that London will be in compliance by 2025 rather than 2030 as expected before. Leeds and Birmingham will meet the limits by 2020, instead of 2025 without the plans.

But the compliance date of 2020 for many cities – including Manchester, Cardiff and Edinburgh – remains unchanged by the plans.

Elizabeth Truss, environment secretary, said: “Our clean air zones are targeted on the largest vehicles, whilst not affecting car owners and minimising the impact on business.

“We want to ensure people can continue to drive into city centres and by targeting action at the most polluting coaches, taxis, buses and lorries we will encourage the use of cleaner vehicles.”

The UK has been in breach of EU limits on annual mean NOx concentrations since 2010 and pleaded for extensions. That led the NGO ClientEarth to bring a court case against the government which culminated in a unanimous verdict in the supreme court ordering a clean-up plan by the end of 2015.

The resulting plan today comes just days after it was revealed that the UK was lobbying against new European limits for carmakers on NOx. The government blames much of the UK’s pollution woes on the failure to introduce real world driving tests in Europe, but the UK has lobbied against those in Brussels.

Screen Shot 2015-12-18 at 08.19.50 Screen Shot 2015-12-18 at 08.20.05 Screen Shot 2015-12-18 at 08.20.15

Andrews said that exempting privately-owned passenger cars was the plan’s biggest weakness.

“The elephant in the room is passenger cars. They are one of the biggest sources of NO2 pollution and yet they are being exempted from the clean air zones. One of the biggest weaknesses of this plan is the failure to adequately address pollution from passenger cars.”

A spokeswoman for the environment department could not explain why 88% of the UK motor fleet was being exempted, but said the focus was on targeting the oldest and most polluting vehicles.

The department said it expected 35 of 43 air quality zones to meet NOx limits by 2020, up from 28 under its earlier projections. “This will lead to significant benefits for the UK, including helping to avoid health impacts,” it said.

The government will be consulting with local authorities on the level of the fees charged to deter the dirtiest lorries, coaches and taxis ahead of the zones taking effect by 2020.

Source: Illegal air pollution will blight many UK cities for at least five years | Environment | The Guardian

Posted in Air Quality, Europe, London, UK | Tagged , , , , , , , , | Leave a comment

Health warning issued as Saharan dust cloud set to send air pollution levels soaring in Peterborough area 

A health warning has been issued as air pollution is expected to reach high levels tomorrow, Thursday December 17.

Levels of air pollution are expected to reach moderate to high levels in the Peterborough, Stamford and Wisbech areas as a cloud of Saharan dust is blown across the region.

Screen Shot 2015-12-17 at 06.36.51

The warning has been issued by Defra (The Department for Environment, Food & Rural Affairs) which recommends that adults and children with lung problems, and adults with heart problems, should reduce strenuous physical exertion, particularly outdoors, and particularly if they experience symptoms.

People with asthma may find they need to use their reliever inhaler more often. Older people should also reduce physical exertion.

Anyone experiencing discomfort such as sore eyes, cough or sore throat should consider reducing activity, particularly outdoors.

Dr Sotiris Vardoulakis, Head of PHE’s Environmental Change Department, said: “Public Health England provides advice to Defra on the health effects of ambient air pollution.

“While most people will not be affected by short term peaks in ambient air pollution, some individuals, such as those with existing heart or lung conditions, may experience increased symptoms.

“On occasions where levels are high, adults and children with lung problems, and adults with heart problems, should reduce strenuous physical exertion, particularly outdoors, and particularly if they experience symptoms. People with asthma may find they need to use their reliever inhaler more often. Older people should also reduce physical exertion. Anyone experiencing discomfort such as sore eyes, cough or sore throat should consider reducing activity, particularly outdoors.”

Saharan dust is lifted by strong winds and can reach very high altitudes; from there it can be transported worldwide by winds, covering distances of thousands of kilometres. The dust gets caught in rain droplets in clouds, falling to the ground in rain. When the water evaporates, a thin layer of dust is left on surfaces, like cars. It can also lead to vivid sunsets.

Levels of air pollution are forecast to be Low over the UK on Friday, but may become Moderate across parts of England and Wales on Saturday. On Sunday, air pollution levels are forecast to be Low across all areas.

A rating of 1,2 or 3 shows low pollution. 4,5 or 6 moderate, while 7,8 and 9 is high.

Source: Health warning issued as Saharan dust cloud set to send air pollution levels soaring in Peterborough area – Peterborough Telegraph

Posted in Air Quality, Europe, UK | Tagged , , | Leave a comment

Three Surprising Parts of the World Where Air Pollution Decreased

Thanks to a super-sensitive new tool, NASA can now see exactly where air pollution is increasing and decreasing–down to the level of neighborhoods–and in some cases, the results are surprising.

In 2004, NASA launched its Aura satellite, a research craft designed to monitor the Earth’s ozone. One of the (many!) instruments aboard Aura was the OMI, or Ozone Monitoring Instrument, which has been sending back information about nitrogen dioxide, or the gas that billows out of our cars, factories, and power plants. It’s the air pollution created when you burn fossil fuels–a yardstick for measuring how well or how poorly a given area of the world is doing at curbing air pollution.

Today, NASA published its analysis of nine years of global air pollution data taken since the launch of Aura, and it gives us a glimpse of exactly where the worst pollution is coming from. But the heat map-style visualizations created for the study also show us where it’s seen some surprising reductions.

Beijing

Here’s one of the biggest surprises. Beijing is notoriously smog-ridden, yet it’s seen a dramatic decrease according to NASA.

What gives? To put it bluntly, the population Beijing–along with Shanghai, and the Pearl River Delta–have had enough. A “growing middle class is now demanding cleaner air,” explains Bryan Duncan, an atmospheric scientist at NASA. Whereas China overall saw huge increases in air pollution (seen in orange below), cities where citizens are demanding cleaner air saw a decrease overall (seen below in blue).

Syria

Duncan points out another aberration: Syria. Whereas other Middle Eastern countries, like Kuwait and Iran, experienced increases, they found something different in Syria. Over the past few years, there was a steep drop off in nitrogen dioxide.

As Duncan explains, that’s due to the double-pronged effect of the civil war there, which crippled the economy and forced millions of people to flee their country. Because most air pollution is caused by economic activity and cars, there’s been a big drop over the past four years.

Some (Not All) Parts of Texas

Texas isn’t exactly a winner when it comes to reducing air pollution, but it’s worth checking out its map for another reason. While urban centers like Dallas, Houston, and San Antonio are cloaked in mild blue thanks to attempts at curbing some of the worst air quality readings in the country, much of the rural parts of the state are reddish-orange.

As Duncan points out, Texas and North Dakota are the only states in the union that saw increases in air pollution over this decade–and they were extreme.

The cause is simple: Fracking and other resource extraction projects. Yeesh.

Duncan presented these results at the American Geophysical Union’s annual meeting today, so we’ll probably see more on this data soon. For now, you can check out NASA’s online recap here.

Source: Three Surprising Parts of the World Where Air Pollution Decreased

Posted in Air Quality, Asia, China, Iran, Middle East, USA & Canada | Tagged , , , , , , , , , | Leave a comment