Mayor Sadiq calls for London air pollution signs and alerts

Transport for London told to ‘urgently’ develop package of public alerts and signs to raise awareness of air pollution

Roadside signposts and online alerts could be used to inform Londoners of air pollution hotspots and periods of poor air quality, under proposals announced today by the capital’s new Mayor Sadiq Khan.

Londoners should be much better informed when air pollution reaches dangerous levels in the UK capital, Khan said, announcing he has directed Transport for London (TfL) to “urgently” develop a package of public alerts and signs aimed at increasing awareness of poor air quality in the city.

Proposals being considered include roadside signs on the most polluted roads, greater promotion of the free airTEXT phone alert service and more effective use of social and traditional media to raise awareness of air pollution.

The Mayor will launch a formal public consultation on a number of air pollution policies in the coming weeks and he said plans to boost awareness of air pollution episodes would be launched as part of the new policy package.

Other policies he has mooted include extending the 2020 ultra-low emission zone (ULEZ) area and investigatory work towards a possible diesel car scrappage scheme.

Khan said new air pollution figures suggested people in London should have been better informed about the dangers to their health during peak pollution periods on more than 100 occasions over the past two and a half years.

Alongside today’s announcement, the Mayor released statistics from King’s College London showing that air pollution in the capital reached ‘moderate’ or ‘high’ levels on the official measurement scale on at least 49 occasions in 2014.sa

The statistics included the high profile Saharan dust episode in April 2014, during which the London ambulance service reported a 14 per cent rise in 999 calls for patients with respiratory issues and a higher than normal volume of calls from people with breathing difficulties, asthma and heart problems.

“I will do everything humanly possible to put the well-being of Londoners first and will be taking robust steps to clean up the capital’s filthy air and drive down the number of days when air quality is dangerously high,” said Khan. “In the short term, I want to ensure Londoners are given clear information and advice during these episodes, when they can take practical measures to protect their health.”

Kay Boycott, chief executive of Asthma UK, said it was “vital” Londoners with asthma know when pollution levels are high so they can “take steps to keep themselves safe”.

“According to the latest figures from the Health Survey for England toxic air affects nearly 600,000 people living in the capital with asthma,” said Boycott. “We urgently need significant investment into asthma research to find practical solutions to this invisible killer and we need governments across the UK to take action to reduce pollution levels.”

Mayor Khan has also joined a recent High Court challenge against the UK government over high NO2 levels in the UK, including London. Environmental NGO ClientEarth’s case was fast-tracked by the Court last week and is now set to be heard in October.

Source: Mayor Sadiq calls for London air pollution signs and alerts

Posted in Air Quality, Europe, London, UK | Tagged , , , , , , , | Leave a comment

Air pollution standards again breached in Timaru

Timaru’s air pollution levels exceeded environmental standards for an eleventh day this year on Tuesday as Geraldine recorded its first breach of the year.

Environment Canterbury’s monitoring station at Anzac Square, Timaru, recorded a 24 hour average PM10 concentration of 56 micrograms on June 21. The same reading was recorded in Geraldine.

A reading over 50 micrograms of suspended particulate per cubic metre of air indicates “high” pollution under the national environmental standard.

PM10 refers to particulate matter in the air that is smaller than 10 micrometres in diameter.

PM10 particles are so small that they can get into the lungs, potentially causing serious health problems.

All but two of the breaches in Timaru so-far this year happened in June. The highest reading of the year was 74 micrograms, which was recorded on June 17.

Timaru had ten high pollution days by June 21 last year. Since 1999, there have been anywhere between seven and 23 days of high pollution by the same day.

Environment Canterbury’s Geraldine station recorded two high pollution days by the same time last year. In previous years, anywhere between zero and 5 days of high pollution were recorded there.

So far this year, the Timaru station has recorded the most high pollution days of all centres monitored by the regional council.

Rangiora has had four high pollution days, while Christchurch has had three and Ashburton has had two. In common with Geraldine, the Washdyke station has recorded one breach this year.

Three main sources of PM10 are home heating, industry and vehicles, from the combustion of fuels such as wood, coal, petrol and diesel.

On a typical winter day in Timaru, an estimated 88 per cent of emissions come from home heating, Environment Canterbury confirmed.

Timaru has an air standard compliance target of three high pollution days from September 1.

It drops to one from September 2020.


Timaru’s PM10 readings this year:

June 21: 56 micrograms of suspended particulate per cubic metre of air. The temperature high for the day was 5 degrees celsius; the low was 5 degrees.

June 18: 58 micrograms (11 degrees, 0 degrees)

June 17: 74 micrograms (17 degrees, -3 degrees)

June 16: 55  micrograms (14 degrees, -2 degrees)

June 9: 70 micrograms (16 degrees, -2 degrees)

June 8: 70 micrograms (10 degrees, -5 degrees)

June 7: 73 micrograms (11 degrees, -3 degrees)

June 6: 59 micrograms (13 degrees, -2 degrees)

June 4: 51 micrograms (15 degrees, -2 degrees)

May 2: 51 micrograms

March 10: 55 micrograms

(Source: Environment Canterbury, Metservice)

Source: Air pollution standards again breached in Timaru | Stuff.co.nz

Posted in Air Quality, Australia & Oceania | Tagged , , , | Leave a comment

Solano smog prompts air pollution alert

Smog that’s expected Tuesday led air quality officials Monday to call to a pollution alert across a large swath of Solano County.

The Bay Area Air Quality Management District projects air quality Tuesday in the district’s Eastern Zone that’s unhealthy for people who are sensitive to air pollution – such as people with asthma or some other condition that affects their ability to breath freely.

Southern Solano County, to include Fairfield, Suisun City, Travis Air Force Base, Benicia and Vallejo, are in the district’s Eastern Zone. Air quality should remain moderate throughout the district ’s remaining four zones, according to the district, but residents there will still be under a Spare the Air alert.

Residents in the Yolo-Solano Air Quality Management District should see moderate air quality Tuesday, based on forecasts in that district.

The Yolo-Solano district includes northern Solano County along with Vacaville, Rio Vista and Dixon.

Summertime Spare the Air alerts are issued when ozone pollution is forecast to reach unhealthy levels. Ozone, or smog, can cause throat irritation, congestion, chest pain, trigger asthma, inflame the lining of the lungs and worsen bronchitis and emphysema, according to the air district. Long-term exposure to ozone can reduce lung function, the district said.

Solano County residents weathered three consecutive days of air pollution alerts early this month. Last summer’s first Spare the Air alert occurred in late July.

The National Weather Service predicts a high Tuesday of 94 at Travis Air Force Base, with winds from the west-southwest of 7 to 9 mph during the day.

High temperatures and pollution from the exhaust of cars and other vehicles combine to produce smog, which lingers when winds are not strong enough to clear the air.

Source: Solano smog prompts air pollution alert

Posted in Air Quality, USA & Canada | Tagged , , , | Leave a comment

Most air polluted places in the country 

Air pollution has been a problem since the industrial revolution hit America in the 1800s. The BBC reports that more than 5.5 million people worldwide die prematurely each year due to air pollution, so this really is nothing to take lightly.

According to the World Health Organization (WHO), more than 80% of people living in urban areas are exposed to levels that exceed WHO limits. In the US, the American Lung Association believes that over 50% of US counties suffer from an unhealthy amount of particle pollution. That’s a whopping 166 million Americans at risk.

These harmful air particles come from such things as coal-fired power plants, diesel emission, or wildfires. The particles are small enough to get stuck in our lungs and this can cause asthma attacks, heart attacks, strokes, and even death.

Here is the American Lung Association’s 2016 State of the Air list showing the top 10 U.S. cities subjected to the worst year-round particle pollution. You may want to consider living elsewhere if you take your health seriously.

Bakersfield, California

Bakersfield is home to a crude oil company, which is nothing but harmful to human health. Contaminants are released at all stages of production. Exhaust fumes discharge particulate matter, while the burning of diesel fuel and natural gas produces the nitrogen oxides that form ground level ozone.

However, the Los Angeles Times reported last year that as fuel prices have dropped, drilling projects in Bakersfield have been delayed or canceled. This may be bad news for the employees being layed off, but residents worried about their lung health can rejoice.

Hanford, California

According to the Hanford Sentinel, it’s no surprise to residents that air quality in this city is worse than ever. To blame are the combustion engines that burn petroleum-based fuels, which release particulate matter, as well as the ever-warming temperatures trapping pollution in this city surrounded by mountains. Officials there know they are over the EPA’s pollution standards, but don’t know how to fix the problem without new technology while long-term drought conditions persist in the area.

Fresno, California

The American Lung Association has been reporting Fresno to be a hotspot of pollution for many years. According to the Los Angeles Times, a 3,000-person-area on the west side of the city is drowning in diesel exhaust, unsafe water, and pesticides. This dirty city is also suffering from poverty, which has only increased since 2000 according to a study done last year by The Century Foundation.

Los Angeles, California

In 2015, the EPA created stricter ozone standards, reducing the limit from 75 parts per billion to 70 parts per billion. The Los Angeles Times reported that the South Coast air basin, including Los Angeles, violated the 75-ppb standard for 92 days in 2014. This new standard has forced Los Angeles to make changes to its transportation and construction equipment, which will hopefully lessen the threat of lung damage.

The edges of the Los Angeles area are also prone to wildfire, especially in light of climate change. Climate Central found that any wildfire burning within 50 to 100 miles of a city can cause air quality to be 5 to 15 times worse than normal. Fires can make air quality up 2 to 3 times worse than the worst non-fire day of the year.

El Centro, California

CNN reported that one of the major factors working against El Centro’s air quality is the fact that it borders Mexico, which has much lower standards for air pollution.

The Imperial County farm in El Centro is also home to 3 dairies and a cheese plant. This only increases area emissions even further, while also reducing available water levels at a time the state is suffering from huge droughts.

Merced, California

Situated between San Jose and Fresno (two other highly polluted cities), Merced has a lot of pollution problems. CNN showed that transportation on Route 99 and Route 140 is a huge contributor to emission-related pollution in the city. This is the route that takes vacationers to Yosemite National Park. According to the American Lung Association, 80% of the pollutants in the city can be traced to transportation sources. The big manufacturers, like Laird and Kirby, add to the pollution problem as well.

San Jose, California

The 2016 State of the Air report from the American Lung Association showed that San Jose had worse numbers for year-round particle pollution than they had in the report prior to 2014, going against a trend of improved air quality since 2000. The Mercury News reported that this is due to drought and high temperatures, which transform pollutants into ozone, as well as wildfires in the area. They also mention the devastating fact that the extreme climate of the city is working against all of the recent improvements in air pollution control programs and cleaner engine standards.

Pittsburgh, Pennsylvania

Pittsburgh is a part of America’s Midwestern “Rust Belt”. This is the country’s heartland of big unionized manufacturers, like the auto and steel industries. CNN reported that the city was once so polluted that streetlights had to be turned on at noon.

Power plants in the city can now switch back and forth between burning coal and natural gas, helping to reduce pollution when gas prices are low. The valleys here help to trap warm air and particulate matter, worsening an already bad problem.

Harrisburg, Pennsylvania

According to Penn Live, air pollution in Harrisburg is a big problem for multiple reasons. First, the 1.2 million people living in the metro area contribute to the pollution problem because of their commutes. Second, there are a lot of  industry emissions. And additionally, the unfortunate location of the city worsens the problem. Winds from Baltimore and Washington, D.C. bring in dirty air from power plants in those cities. The number of unhealthy days of ozone in the city was 64 in 2015, according to theAmerican Lung Association.

Louisville, Kentucky

Like many other cities on the list, Louisville’s geography doesn’t play in its favor. The surrounding hills help trap dirty air for long periods of time, especially in warm weather. General Electric is one of the major plants in the area, contributing to huge emissions. However, there is a glimmer of hope here: GE has promised to comply with waste-reduction and recycling efforts and has reduced its emissions by 12% since 2005.

Source: Most air polluted places in the country – Business Insider

Posted in Air Quality, USA & Canada | Tagged , , , , , , , , , , , , , , , , , | Leave a comment

Rajshahi: the city that took on air pollution – and won 

Once, Rajshahi’s sweltering summers were made worse by a familiar problem on the Asian subcontinent: windows would have to be shut, not because of the wind or monsoon, but because of the smog.

Dust blown up from dry riverbeds, fields and roads, and choking smog from ranks of brick kilns on the edge of town helped to secure the place a spot in the top tier of the world’s most polluted cities.

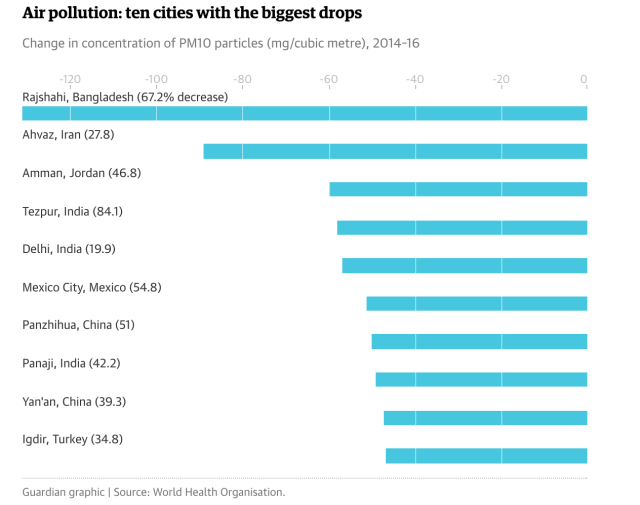
Then suddenly Rajshahi, in Bangladesh, hit a turning point so dramatic that it earned a spot in the record books: last year, according to UN data, the town did more than any other worldwide to rid itself of air particles so harmful to human health.

“We didn’t know about this,” admits Ashraful Haque, the city’s chief engineer, who like some of his fellow residents is rather bemused by the achievement.
Screen Shot 2016-06-18 at 12.28.18

Rajshahi does not have a large industrial area, and it is too poor to have streets clogged with cars. Instead, Haque believes it was the campaign to clean up the brick kilns, as well as efforts to make the city greener, that have turned the tide.

Levels of larger PM10 particles went from 195 micrograms per cubic metre in 2014, to just 63.9 in 2016, a reduction of about two-thirds, and the largest in the world in absolute terms. Smaller PM2.5 particles have been nearly halved to 37 micrograms per cubic metre from 70.

Haque, who was born and educated in the city, remembers as a child having to close windows and doors to shut out a thin film of dirt that would settle across every surface in the house when a wind swept in from outside.

Nowadays it’s a different city, thanks to the campaign that began with a tree-planting drive more than 15 years ago, and now encompasses everything from transport to rubbish collection. Dust still hangs heavy in the air on occasions, but the transformation has been welcomed by local residents in a country where urban authorities more often generate frustration and resentment.

“Things have got better for my classmates with asthma,” said Fatema Tuzzohra, a 13-year-old enjoying a riverside park after school. “I love the city, it is really clean and green.”

The city began tackling transport issues in 2004, importing a fleet of battery-powered rickshaws from China, and banning large lorries from the city centre in daytime. The three-wheelers are the main form of public transport, and their batteries keep the air free of the petrol and diesel fumes that hang over other cities.

Upgrades to the brick kilns, such as changing chimneys and fuel, have reduced the amount of pollution they spew out around the city, Haque says. And he has personally designed and overseen a project to make the city centre greener while reducing the amount of dust kicked up by people and vehicles.

“We have a ‘zero soil’ programme in the city, with lots of planting and green intervention. When it works, there should be no part of the road that will be dirt. It will be all grass, flower or pavement,” says Haque.

He became convinced that the city needed more pavements after trips to study urban planning abroad. At the time the asphalt surfacing of the city roads mostly ended in a dusty verge, sometimes with open drains, dangerous and unappealing for walking along, he said.

“In 2010, after a visit to London, I started creating pavements. I couldn’t believe it, everyone has to walk at least 2km a day [in London], but here people finish lunch and look for a rickshaw. Even in the good neighbourhoods, there are no pavements.”

Apart from encouraging a healthier lifestyle, they are vital for controlling dust in the air, he says. “If you have them, no soil will fly during the summer seasons.” So far they have built about 9 miles (15km) of pavements, but soon hope to expand to 30, he said.

The road transformation will go beyond pedestrians this month, when city workers start building the city’s – and the country’s – very first cycle lane.

Take-up is likely to be slow in a city already sweltering in the summer heat, and where the only people on bicycles are those too poor to afford other transport, Haque admits. But inspired by trips abroad, he hopes to sow the first seeds of change.

“I went to the river Thames and saw people riding bikes, I got the idea from Japan and China as well. We don’t have enough land for a separate lane in many places, but where we can we will separate with a border, making a pavement and a cycle lane beside it.”

People are proud of their town, and have started looking after it more closely after the transformation, says restaurateur SM Shihab Uddin, who spent nearly a decade working in Cyprus before returning to open his own chain of eating spots for the growing middle class.

“It has changed so much,” he said. “I came back in 2009, and I was worried that I would find it hard to live here after so much time abroad. But it was already transformed.”

Saad Hammadi contributed to this report.

India’s cleanest city

The small city of Tezpur in east India has traditionally had little to brag about. The holy Brahmaputra river roars at its edges and the mighty Himalayan mountains adorn its skyline, but couched between these geographical marvels, Tezpur itself is little more than a layover stop for travellers in the state of Assam.

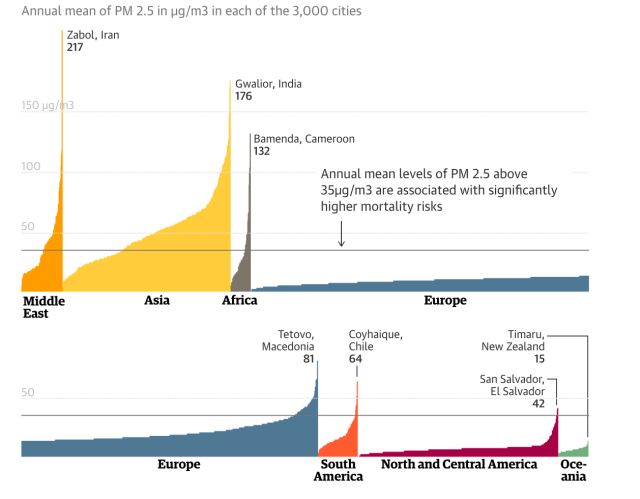
But while many of India’s industrial towns have reached peak pollution levels, Tezpur’s air is getting cleaner. Since the last WHO air-quality report in 2014, Tezpur’s PM10 pollution, caused by dust particles, has reduced more than any other Indian city to close to 15% of the level it was.

Tezpur’s PM10 levels now stand at 11mg per cubic metre. According to WHO guidelines, the permissible limit for PM10s is 20mg per cubic metre.

Tezpur’s air-quality improvement stands out in India, where focus on industrial development and rapid urbanisation in recent years has driven pollution levels up in most other cities. According to the WHO report, six of the 10 most polluted cities in the world are in India, putting millions of people at serious risk of cardiac and respiratory infections.
Screen Shot 2016-06-18 at 12.30.02

M Nath, senior environmental engineer at the Pollution Control Board, says Tezpur’s clean air is noticeable to travellers from other cities. “When we have visitors from other cities like Delhi or Guwahati, they immediately feel the difference in the air quality here,” Nath says. “But we’re a small city, we don’t have any major industries that cause a lot of pollution and people are conscious [about the environment]. It may not be so easy in other places.”

It is difficult to single out one reason for Tezpur’s improvement , but Nath explains that heightened awareness means people are making conscious efforts to go green. “People in Tezpur are very conscious about the environment,” Nath says.

In recent years, rising incomes and greater awareness about the environment means people have started buying cars that meet the latest emission standards, and discarded older, polluting vehicles.

Last year, more than 800 trees were planted by students in the city, as part of a massive environmental campaign at Tezpur University.

Activists such as Jadav Payeng, nicknamed “India’s forest man”, have also made significant efforts to improve the environment in regions near Tezpur. For the last 30 years, Payeng has planted a forest’s worth of trees, covering 550 hectares (2.1 sq miles) of land.

Industrial efforts to cut back on coal-powered machines have also helped significantly. “The supply of liquefied petroleum gas [LPG] has improved a lot, and so many tea plantations are using it now,” he says. LPG is produced from fossil fuels, but produces virtually no particulate pollution compared with burning coal.

Assam’s hundreds of plantations produce nearly 700,000kg of tea a year, mostly exported around the world. Until recently, many of them depended solely on coal to fuel their machines.

Nath says LPG has now reached even more remote village areas near Tezpur. Access to LPG and subsidies from the government have prompted many villagers to use cleaner fuel for cooking and burning waste. “People don’t need to use wood fires any more; most of them have access to LPG.”

Sanjiv Eastment, a manager for McLeod Russel, the world’s biggest tea producer, says he can feel the improvement in air quality since the company started using LPG in their incinerators. “Not just outside, you can feel it in the factory itself,” he says. “There’s no more dust, no more breathing problems.”

Eastment estimates that better technology and more easily available LPG have saved thousands of tonnes of coal in recent years. “We make around 100m kilos of tea a year, and for each kilo of tea we burn around 1kg of coal. But it used to be much more – 1.6, 1.8 kilos a few years ago. Now we have new boilers that are more energy efficient and our incinerators are fuelled by LPG,” he says. “We still need to use coal for our tea dryers though.”

According to Eastment, the company switched from coal to LPG because it was cheaper. “After all we’re in the business of tea to make money,” he says.

Strong regulation and demands from foreign countries to meet production standards have also contributed to the change. Foreign countries have become less willing to accept tea imports unless they are certified by the Rainforest Alliance. “It means that all open fires have stopped – even in the workers’ quarters, to cook or burn waste,” Eastment says. “That makes a really big difference.”

For Nath though, it is adopting the right attitude to the problem that is key. The Pollution Control Board has run campaigns in schools and villages to encourage people to adopt greener lifestyles. “People have been very enthusiastic,” Nath says. “They are really proud about the environment here … We look after our city.”

  • This article has been amended to correct air pollution measurements of PM10 and PM2.5 particles mistakenly given in terms of square metres rather than cubic metres. Miles were also misspelled as mines.

Source: Rajshahi: the city that took on air pollution – and won | World news | The Guardian

Posted in Air Quality, Asia, India | Tagged , , , , , , , | Leave a comment

Timaru air pollution breaches standards for eighth time 

Timaru’s air pollution levels exceeded environmental standards for an eighth day, a week after the last breach.

Environment Canterbury’s monitoring station on Anzac Square recorded a 24 hour average PM10 concentration of 55 micrograms on Thursday.

A reading over 50 micrograms of suspended particulate per cubic metre of air indicates “high” pollution under the national environmental standard.

Readings breached 50 micrograms four times last week. They breached 70 micrograms three of those times.

Timaru had nine high pollution days by the same time last year. Since 1999, there have been anywhere between six and 20 days of high pollution by June 16.

So far this year, the Timaru station has recorded the most high pollution days of all centres monitored by the regional council.

Ashburton, Christchurch and Rangiora have had two high pollution days, while Washdyke has had one.

PM10 refers to particulate matter in the air that is smaller than 10 micrometres in diameter.

PM10 particles are so small that they can get into the lungs, potentially causing serious health problems.

Three main sources of PM10 are home heating, industry and vehicles, from the combustion of fuels such as wood, coal, petrol and diesel.

On a typical winter day in Timaru, an estimated 88 per cent of emissions come from home heating, Environment Canterbury confirmed.

Timaru has an air standard compliance target of three high pollution days from September next year.

It drops to one from September 2020.

Source: Timaru air pollution breaches standards for eighth time | Stuff.co.nz

Posted in Air Quality, Australia & Oceania | Tagged , , , | Leave a comment

Diesel cars in London increase despite air pollution warnings 

Figures show the numbers of licenced diesels rose by 29% from 2012-15, despite warnings over their contribution to illegal levels of air pollution

Diesel vehicles have taken a record share of the market on London roads in recent years, despite warnings blaming them for contributing to the capital’s illegal levels of air pollution.

Sadiq Khan, the new mayor of London, has been lobbying for a diesel scrappage scheme, a policy that was backed by his predecessor, Boris Johnson, as a way of tackling the illegal high nitrogen dioxide (NO2) levels caused by diesels.

Experts have been speaking out since 2012 about the link between diesel vehicles and the toxic gas, which is above EU limits in dozens of British cities.

But the warnings have not been heeded by motorists, with the number of diesels licenced in London rising from 601,456 in 2012 to 774,513 in 2015, an increase of nearly 29%. Petrol vehicles fell over the same period, from 1,901,127 to 1,797,099, leaving diesel with a record high percentage of the market, at 29.4%.

“Government can no longer turn a blind eye to the serious consequences of diesel emissions,” said Leonie Cooper, Labour’s London assembly environment spokesperson, who obtained the figures from the Department for Transport.

“This worrying rise in diesel engines shows that they are running out of opportunities to bat away calls for a scrappage scheme.”

While the government has rejected calls for a diesel scrappage scheme, the transport secretary, Patrick McLoughlin said last week that the chancellor would need to consider increasing tax on diesel fuel to address air pollution.

However, new diesel cars sold since September 2015 have had to meet stringent new standards which cut nitrogen oxide emissions – which include NO2 – by 67% on the previous standard.

Cooper also criticised the “lax” mayoral record of Johnson on pollution, who was recently accused of burying a reportrevealing the severity of the city’s dirty air problem and how it disproportionately affected children at poorer schools.

Khan’s first major policy announcement was to say he would double the size of a planned clean air zone in London, and bring it in a year earlier than planned.

This week Khan added that he would like to get new powers to set ‘road tax’ rates, vehicle excise duty, which has been blamed by campaigners for incentivising the switch to diesel.

“VED [vehicle excise duty] collected from London registered vehicles could be devolved, allowing the mayor to set the rates and determine how the income raised is spent. If VED was devolved, it would be possible to restructure the way it is levied so as to tackle air quality by incentivising cleaner vehicles and investing VED revenue into air quality measures,” said a submission by the mayor to a court case being brought against the government over its clean air plans. Khan joined the high court challenge by NGO ClientEarth last month.

A spokeswoman for the mayor said: “Cleaning up London’s toxic air will be impossible without urgent government action. National policies caused the dieselisation of the vehicle fleet so it is only right government now sort out the consequences.

“Implementing a national diesel scrappage scheme is something that should have been addressed years ago and would quickly reduce the number of polluting vehicles driving throughout the capital every day.”

A public consultation will take place this summer on his new measures to tackle air pollution in London.

Source: Diesel cars in London increase despite air pollution warnings | Environment | The Guardian

Posted in Air Quality, Europe, London, UK | Tagged , , , , , , , | Leave a comment

More Than 12 Million Americans Are Threatened by Toxic Air Pollution From Oil and Gas Industry: Here’s an Interactive Map 

Two leading national environmental groups—Clean Air Task Force (CATF) and Earthworks—unveiled a suite of tools Wednesday designed to inform and mobilize Americans about the health risks from toxic air pollution from the oil and gas industry.

For the first time, Americans across the country—from Washington County, Pennsylvania, to Weld County, Colorado to Kern County, California—can access striking new community-level data on major health risks posed by oil and gas operations across the country.

The oil and gas industry is the country’s largest and fastest-growing source of methane emissions. And its facilities emit numerous other hazardous and toxic air pollutants along with methane—including benzene, formaldehyde, acetaldehyde and ethylbenzene. That toxic pollution presents significant cancer and respiratory health risks, underscoring the need for the U.S. Environmental Protection Agency (EPA) to clean up existing sources of toxic air pollution without delay.

The EPA recently signed New Source Performance Standards (NSPS) that for the first time will regulate methane pollution from new and modified oil and gas facilities, preventing some of the sector’s future toxic air pollution from being released. The EPA’s current regulations addressing the industry’s toxic air pollution are limited and the NSPS does not cover the 1.2 million existing facilities in 33 states. CATF’s report, Fossil Fumes, and Earthworks’ Oil & Gas Threat Map focus specifically on toxic pollutants from those facilities and their resulting health impacts.

Earthworks Oil & Gas Threat Map Summary

The Oil and Gas Threat Map maps the nation’s 1.2 million active oil and gas wells, compressors and processors. Using the latest peer-reviewed research into the health impacts attributed to oil and gas air pollution, the map conservatively draws a half mile health threat radius around each facility. 

Within that total area are:

  • 12.4 million people
  • 11,543 schools and 639 medical facilities
  • 184,578 square miles, an area larger than California

For each of the 1,459 counties in the U.S. that host active oil and gas facilities, the interactive map reports:

  • instances of elevated cancer and respiratory risk
  • total affected population (with separate counts for Latino & African-Americans)
  • total affected schools and medical facilities

The searchable map allows users to:

  • look up any street address to see if it lies within the health threat radius
  • view infrared videos which makes visible the normally invisible pollution at hundreds of the mapped facilities
  • view 50+ interviews with citizens impacted by this pollution

“The Oil & Gas Threat Map shows that oil and gas air pollution isn’t someone else’s problem, it’s everyone’s problem,” Earthworks executive director Jennifer Krill said.

“Our homes and schools are at risk while most state regulators do nothing. Although completely solving this problem ultimately requires ditching fossil fuels, communities living near oil and gas operations need the EPA to cut methane and toxic air pollution from these operations as soon as possible.”

Clean Air Task Force Fossil Fumes Report Summary

Fossil Fumes, CATF’s companion report to Earthworks’ Oil and Gas Threat Map, is based on EPA’s recent National Air Toxics Assessment (NATA) analysis updated to reflect the latest emissions data from EPA’s National Emissions Inventory (NEI) and the conclusions are striking.

The report finds that:

  • 238 counties in 21 states face a cancer risk that exceeds EPA’s one-in-a-million threshold level of concern
  • Combined, these counties have a population of more than 9 million people and are mainly located in Texas, Louisiana, Oklahoma, North Dakota, Pennsylvania and Colorado
  • Of these counties, 43 face a cancer risk that exceeds one in 250,000 and two counties in West Texas (Gaines and Yoakum) face a cancer risk that exceeds one in 100,000
  • 32 counties, primarily in Texas and West Virginia, also face a respiratory health risk from toxic air emissions that exceeds EPA’s level of concern (with a hazard index greater than one)

“The Fossil Fumes report and Earthwork’s Interactive Threat Map will allow concerned citizens to learn the cancer and respiratory risks they face from toxic air pollution from the oil and gas industry,” Lesley Fleischman, CATF technical analyst and author of Fossil Fumes, said. “Armed with this information, we trust that citizens and communities will demand protective safeguards requiring industry to clean up its act and reduce these serious risks to public health.”

“The Oil & Gas Threat Map and Fossil Fumes are outstanding tools for nurses, their patients and affected communities to better understand the health risks posed by oil and gas facilities,” Katie Huffling, director of programs for the Alliance of Nurses for Healthy Environments, said.

“As nurses, we are especially concerned by the number of schools and hospitals revealed to be within a half mile of an active oil and gas facility. The best available science shows that methane and toxic chemicals emitted by these facilities threaten our most vulnerable citizens, which is why we encourage the EPA to quickly address this pollution.”

Other key findings of the map and report at the statewide level include:

  • Los Angeles County, California is home to the most impacted “vulnerable” populations: there are more impacted schools and hospitals in Los Angeles than any other county in America (226 schools and 60 hospitals)
  • There are particularly widespread impacts in Texas, with 15 counties with more than 75 percent of their populations living within ½ mile risk radius and 32 percent of Texas counties have elevated oil and gas health risks (82 out of 254)
  • Almost 25 percent of all Pennsylvanians live within the half-mile threat radius

“The Oil & Gas Threat Map and Fossil Fumes show more than 12 million Americans need protection from oil and gas industry air pollution as soon as possible. Industry talks about voluntarily reducing their pollution, but refuses to make binding commitments,” Earthworks policy director Lauren Pagel said.

“Some states like Colorado have stepped up, but other states like Texas have vowed never to regulate greenhouse gases and associated toxics. It is only the U.S. Environmental Protection Agency that can act to protect all Americans, their health and the climate from this pollution.”

Source: More Than 12 Million Americans Are Threatened by Toxic Air Pollution From Oil and Gas Industry: Here’s an Interactive Map | Alternet

Posted in Air Quality, USA & Canada | Tagged , , , | Leave a comment